Spectrum Measurements
R&S
®
ESR
400User Manual 1175.7068.02 ─ 12
several columns (depending on measurement) which are also separated by a semico-
lon.
Exporting a single trace vs exporting all traces
Note that the file containing the trace data has a slightly different structure when you
export all traces compared to exporting a single trace only. The differences are indica-
ted in the tables below.
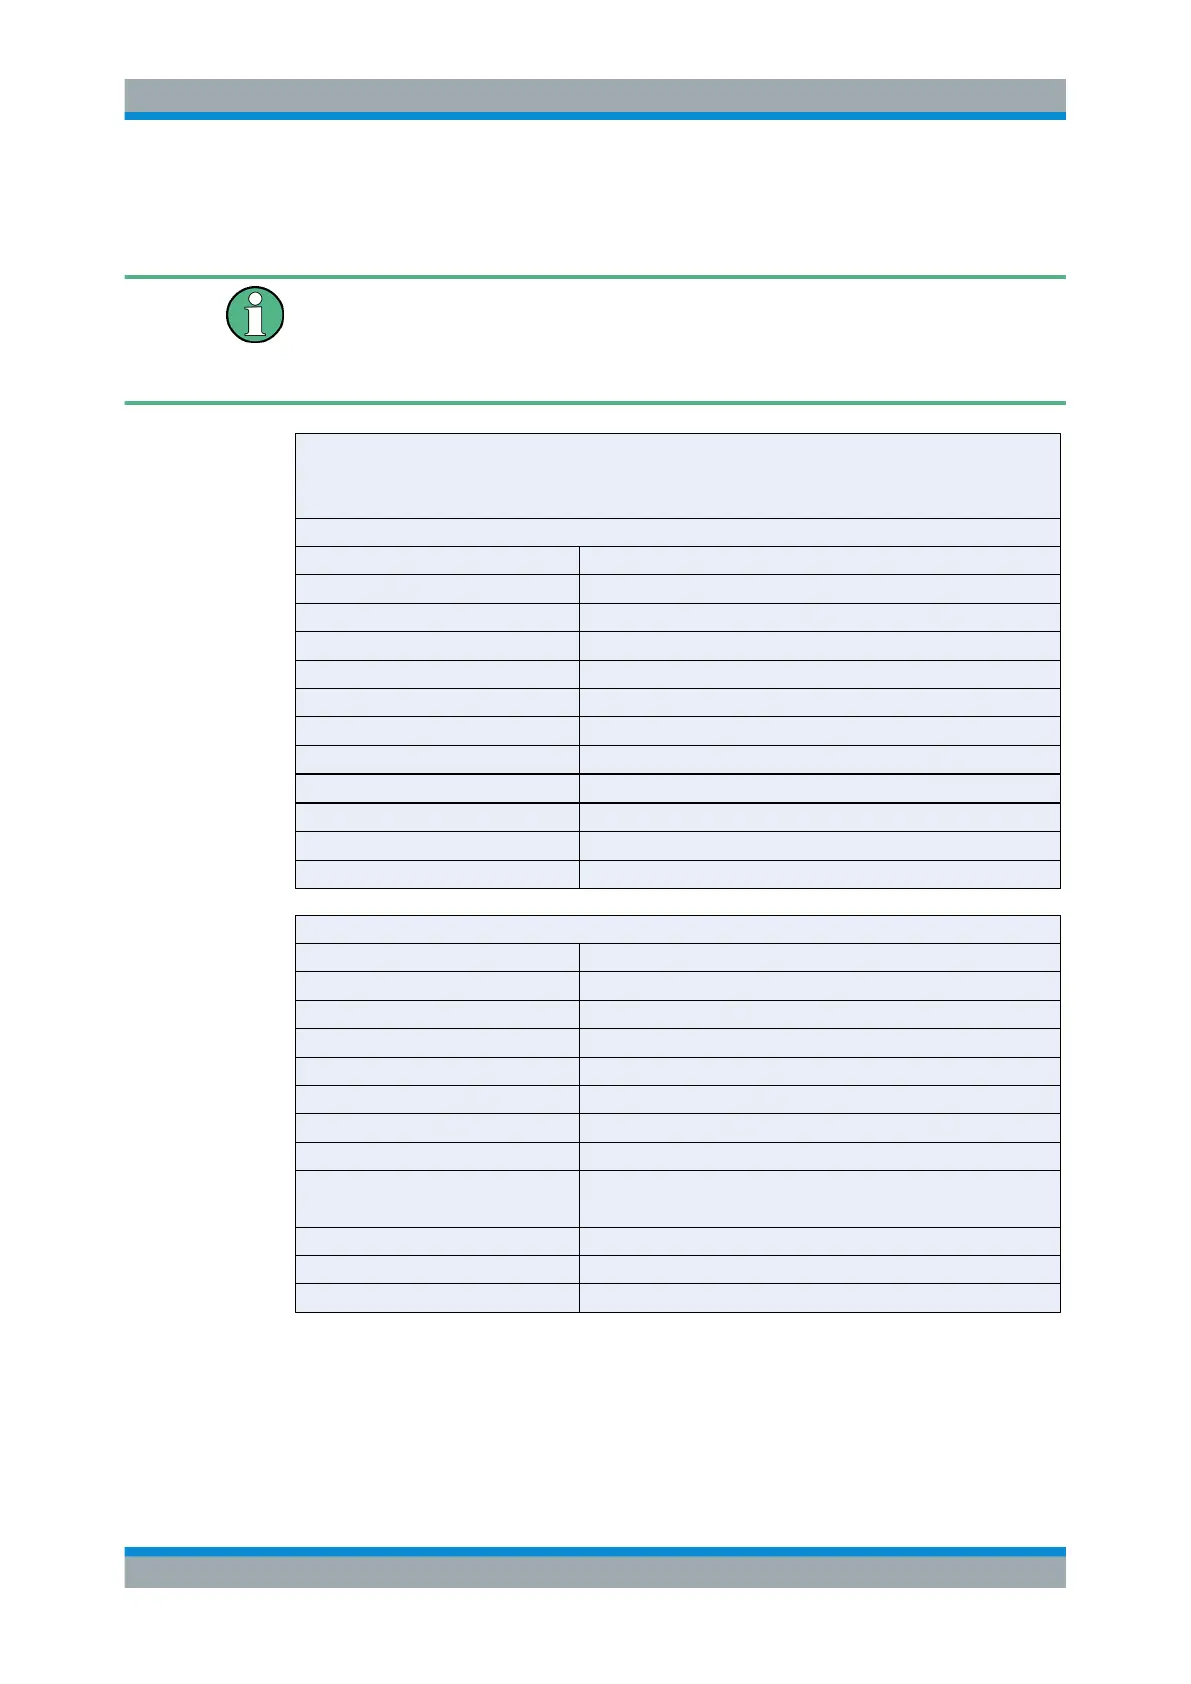
Type; <instrument_model>; Instrument model
Version;1.00; Firmware version
Date;01. Jan 3000; Date of data set storage
Mode;Receiver; Application
Start;150000.000000;Hz Start frequency of the scan
Stop;100000000.000000;Hz; Stop frequency of the scan
X-Axis;LIN;
X-Unit;Hz;
Y-Unit;dBµV;
Header
Blue font: Information provided when you export a single trace
Green font: Information provided when you export all traces
Black font: Information provided regardless of the export mode
Scale of the x-axis
Unit of the x-axis
Unit of the y-axis
Scan Count;1;
Transducer;;;;;;;;
Scan count
Transducer information
Detector;Average; Detector type
Data section (scan ranges)
Scan 1:
RF Att;10.000000;dB; Attenuation applied in the scan range
Auto Ranging;OFF; State of the auto ranging feature
Meas Time;0.001000;s; Measurement time in the scan range
Start;150000.000000;Hz; Start frequency of the scan range
Stop;29998500.000000;Hz; Stop frequency of the scan range
Step;4500.000000;Hz; Frequency stepsize applied in the scan range
RBW;9000.000000;Hz; Measurement bandwidth applied in the scan range
Auto Preamp;OFF;
Preamp;0.000000;dB;
Preamplifier information for the scan range
RF Input;1; RF input used in the scan range
Scan 2:
(…)
Analysis

 Loading...

