Spectrum Measurements
R&S
®
ESR
404User Manual 1175.7068.02 ─ 12
points, depending on the dimension of the x-axis. If there are more measurement
values than measurement points, several measured values are combined in one
measurement point using the selected detector (see Chapter 6.3.1.5, "Detector
Overview", on page 399). Frames are sorted in chronological order, beginning with
the most recently recorded frame or frame number 0 at the top of the diagram.
After that and below frame 0 is the frame recorded before the current frame (frame
-1) and so on until the maximum number of captured frames is reached. The maxi-
mum number of frames that you can capture is summarized in the table below (see
Table 6-7. A marker in the form of an arrow (3) on the left and right border of the
Spectrogram indicates the currently selected frame.
The actual number of the currently selected frame is shown below the diagram (4).
If the time stamp is active, the R&S ESR shows the time stamp instead of the
frame number (see Time Stamp (On Off).
Below the diagram there is also a color map (5) that shows the power levels corre-
sponding to the displayed colors. The minimum value of the y-axis is on the left of
the color map. The maximum value is on the right of the map. You can also change
the color scheme in use (see Color Mapping. The colors corresponding to the
power levels, however, are always assigned automatically.
Markers and deltamarkers (6) (7) take the form of diamonds in the Spectrogram.
They are only displayed in the Spectrogram, if the marker position is inside the visi-
ble area of the spectrogram. If more than two markers are active, it is possible to
display a Marker Table at the bottom of the display (8).
Table 6-7: Correlation between number of sweep points and number of frames stored in the history
buffer
Sweep Points Max. History Depth
≤1250 20000
2001 12488
4001 6247
8.001 3124
16.001 1562
32.001 781
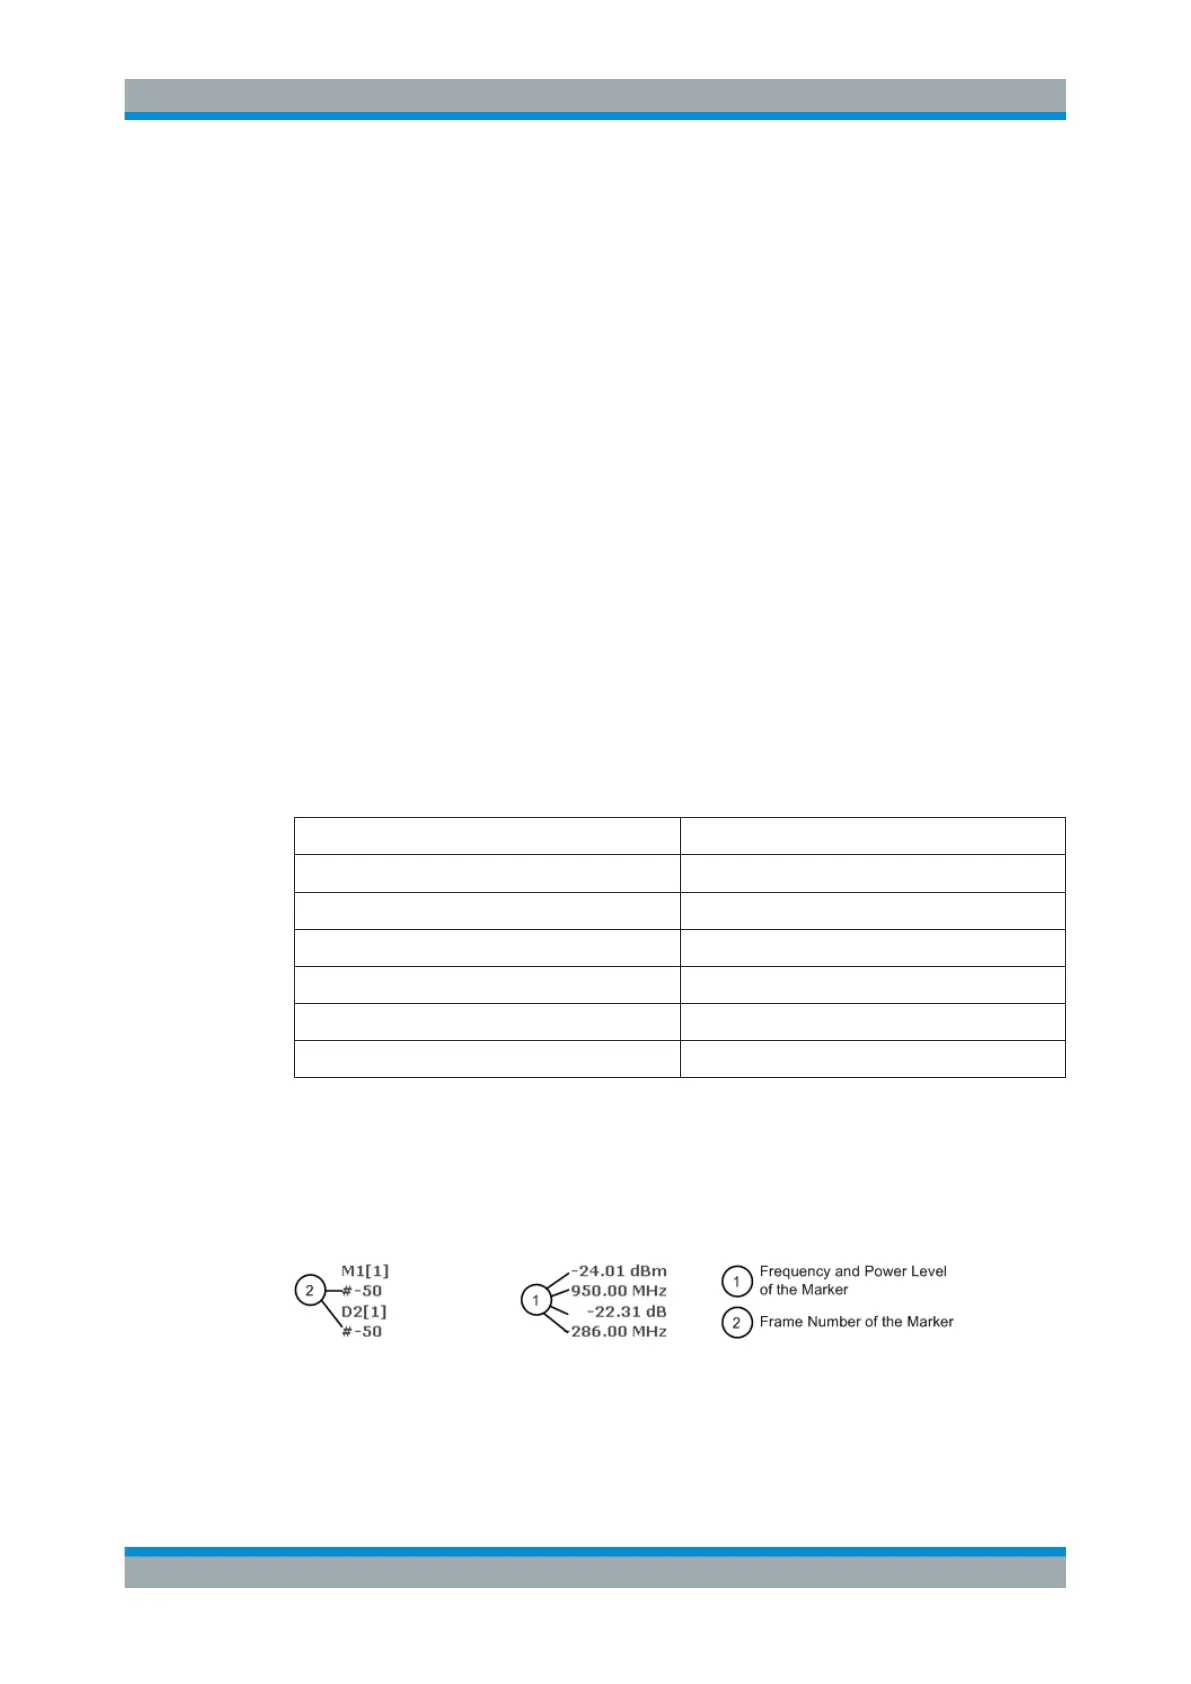
Markers and Marker Values
In the Spectrum Analyzer result display, the markers and their frequency and level val-
ues (1) are displayed in the marker field just like in the base unit (see Chapter 5.4.2,
"Markers", on page 200). In addition to the base unit functionality, the frame number is
displayed to indicate the position of the marker in time (2).
In the Spectrogram result display, you can activate up to 16 markers or deltamarkers at
the same time. Any marker can be assigned to a different frame. Therefore, in addition
to the frequency (1) you can set the frame number (2) when activating a new marker. If
no frame number is specified, the marker is positioned on the currently selected frame.
Analysis

 Loading...

