10-13
IM DLM6054-01EN
Analysis and Searching
10
Explanation
Measurement Source Waveform (Trace)
You can set the source waveform to a channel from CH1 to CH4 or M1 to M4 or to a logic signal
bit from A0 to D7. (On 16-bit models, you can choose a logic signal bit from A0 to A7 or C0 to
C7.)However, you cannot measure snapshot waveforms or accumulated waveforms other than the
most recent one.
Measurement Items (Item)
You can choose from the 30 measurement items and delay measurement items listed below. (The
characters in parentheses indicate how an item is displayed on the screen.)
• The DL6000/DLM6000 can store a total of up to 100000 data
values for all areas and traces (CH1
to CH4, M1 to M4, and Logic).
• A
total of up to 16 measurement items can be displayed on the screen.
• The measurement items that you can select when the source waveform is a logic signal are Freq,
Period, Avg Period, +Width, -Width, Duty, Edge Count,
D
T, and Delay.
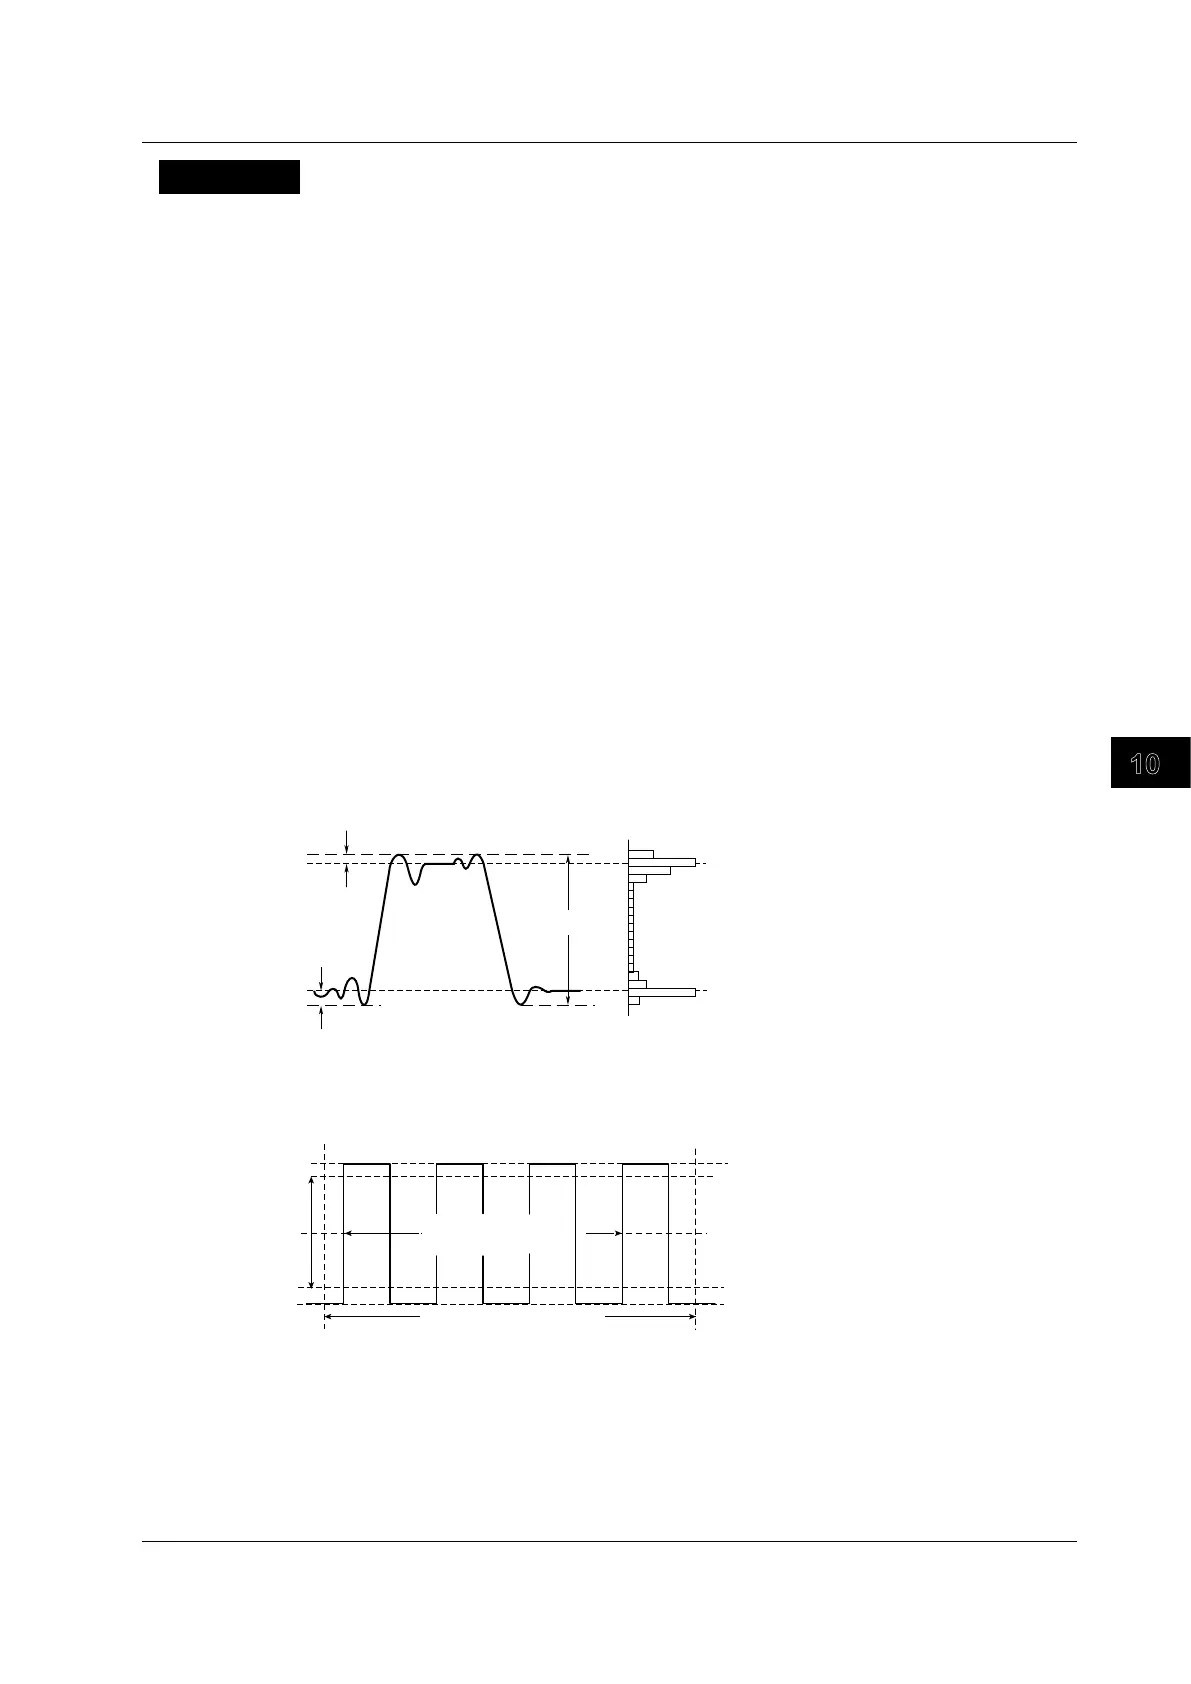
Voltage Measurement Items
P-P
Max
Min
High
Low
+Over
–Over
Max (Max): Maximum voltage [V]
Min (Min): Minimum voltage [V]
High (High): High voltage [V]
Low (Low): Low voltage [V]
P-P (P-P): P-P value (Max – Min) [V]
Hi-Low (Hi-Low): The high voltage value minus the low
voltage value
+Over (+Over): Overshoot [%]
(Max – High)/(High – Low) × 100
–Over (–Over): Undershoot [%]
(Low – Min)/(High – Low) × 100
Rms (Rms): Rms voltage [V] (1/ (√n))(Σ(xl
2
))
1/2
Mean (Mean): Mean voltage [V] (1/n) Σxl
Sdev (Sdev): Standard deviation [V] ((Σxl
2
– (Σxl)2/n)/n)
1/2
IntegTY (ITY): Sum of the positive and negative areas under
the curve [Vs]
√
Measurement time range
T Range1
Integer multiple of the
waveform period
Hys
Level (threshold):
T Range2
C.Rms (CRms): The rms value over an integer multiple of the waveform period within the measurement time range [V]
C.Mean (CMean): The mean voltage over an integer multiple of the waveform period within the measurement time
range [V]
C.Sdev (CSdev): The standard deviation over an integer multiple of the waveform period within the measurement time
range [V]
C.IntegTY (CITY): The average of the areas of the positive and negative amplitudes in each period [Vs]
Max or High (100% when Mode is set to Auto)
Upper (80% when mode is set to Auto)
(Upper – Lower)/2 (50% when Mode is set to Auto)
Min or Low (0% when Mode is set to Auto)
Lower (20% when Mode is set to Auto)
V1 (V1(x)): The voltages where each trace intersects T-Range1 (the cursor on the left that
determines the measurement time range)
V2 (V2(x)): The voltages where each trace intersects
T-Range2 (the cursor on the right that
determines the measurement time range)
D
T (
D
T(x)): The time dif
ference between T-Range1 and T-Range2
* The name of the trace goes in the area marked an x. For example, for CH1, C1 would appear
instead of x; for M1, M1 would appear; and for logic signal A0, LA0 would appear.
10.2 Automatically Measuring Waveform Parameters
 Loading...