10-50 IM 701450-01E
Explanation
This section explains the setup procedures for performing automated measurement on
various measurement parameters on the displayed waveform (within the display record
length, see appendix 1). Up to 24000 data points of the results of automated
measurements can be saved to a file (see section 12.10).
Limitations
Automated measurement of waveform parameters cannot be performed on the
following waveforms.
• Snapshot waveforms
• Accumulated waveforms (except the last accumulated waveform)
• Logic input waveforms
Automated Measurement Mode
The following modes are available in automated measurement of waveform parameters.
OFF
Automated measurement is not performed.
ON
Measures the specified parameters.
Statistics, Cycle Statistics, and History Statistics
Performs statistical processing on the measured results of the specified parameters. See
section 10.7.
Number of Measurement Parameters
Measurements can be made on 26 types of parameters and delay between waveforms.
Up to 24000 data points of measurement parameters of all waveforms can be saved.
Number of Parameters That Can Be Displayed
Automated Measurement Mode Number of Displayed Parameters
ON Displays up to 12 parameters of all waveforms. The order in
which the waveforms are listed is the same as the order in
which the waveforms appear in the menu used to select the
waveforms to be measured. The order in which the
parameters are listed is the same as the order in which the
parameters appear in the Item Setup dialog box.
Statistics Displays up to 2 statistical values of the measurement parameters
of all waveforms. The order in which the waveforms and
parameters is listed is the same as the ON case.
Cycle Statistics Same as Statistics.
History Statistics Same as Statistics.
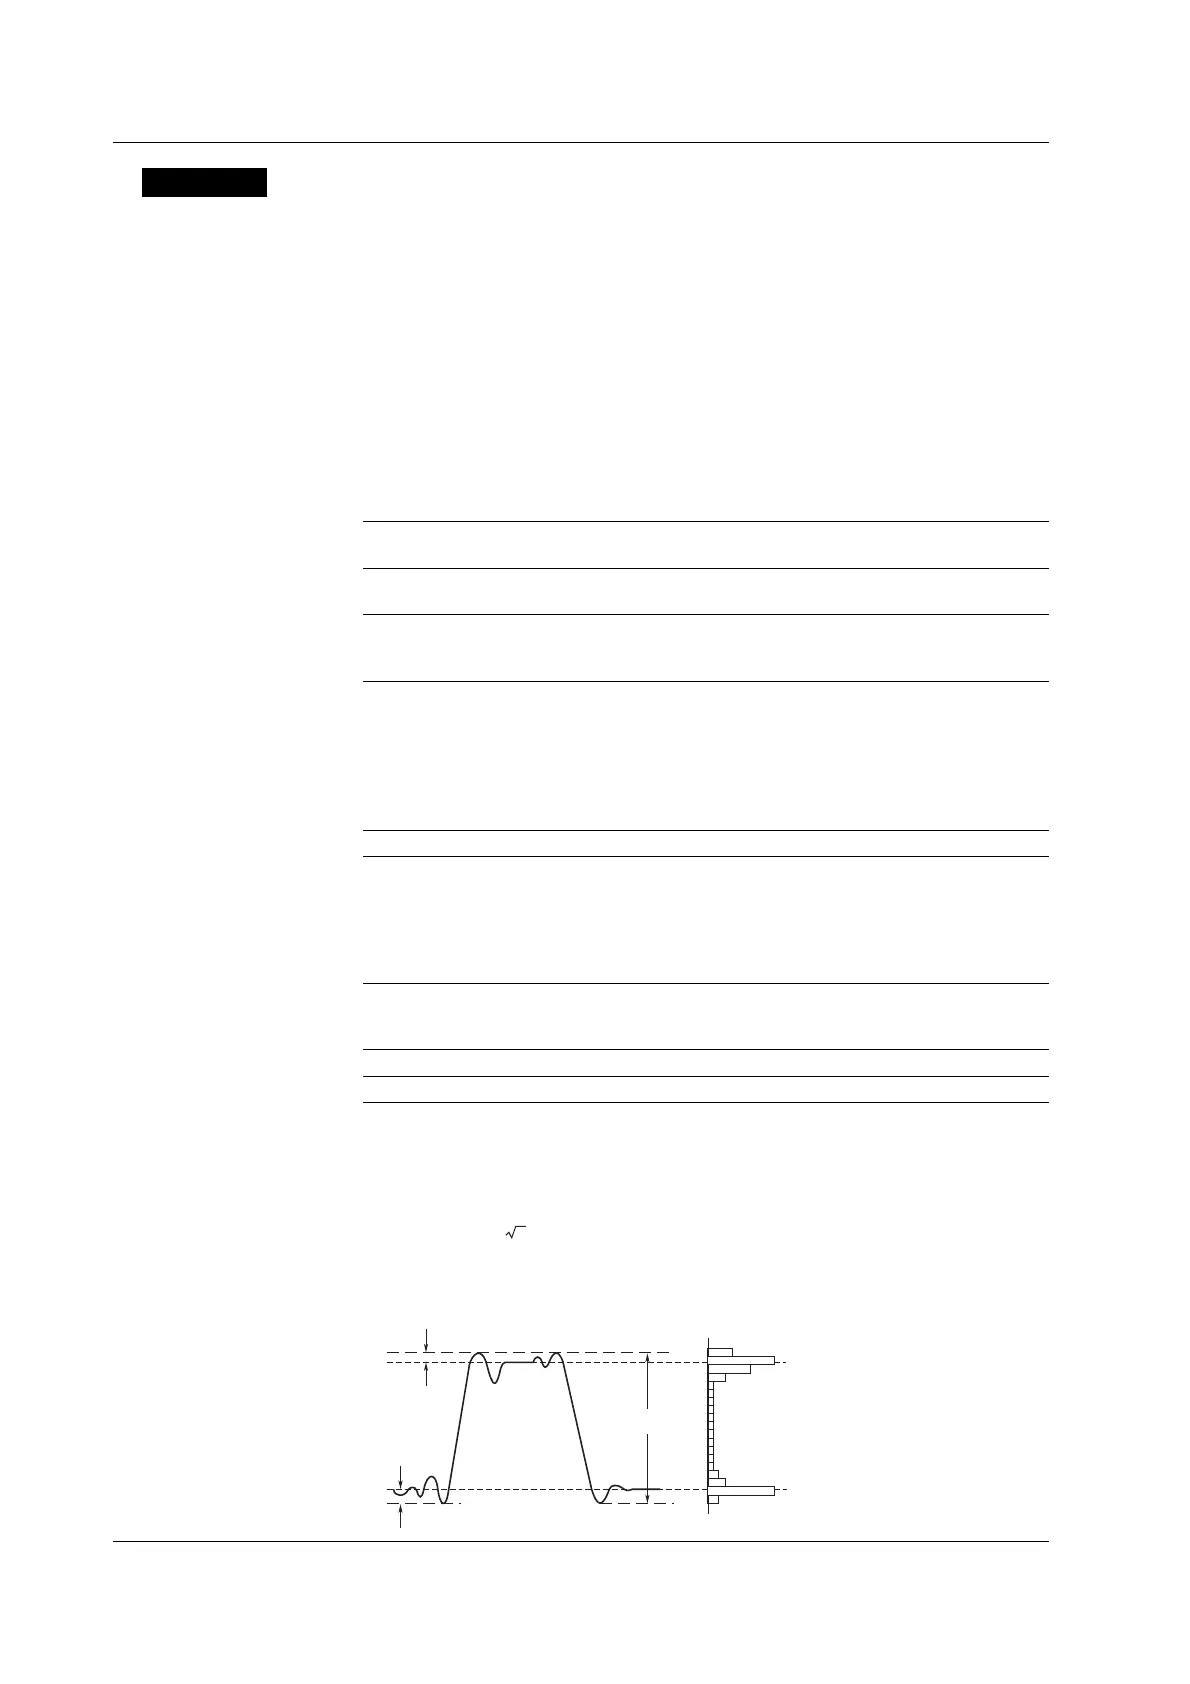
Voltage-Axis Parameters
P-P
Max
Min
High
Low
+
OShot
–OShot
P-P:
Max:
Min:
Rms:
Avg:
Sdev:
(SDv)*:
–OShot:
(–vr)*:
+OShot:
(+Ovr)*
High:
Low:
* The characters inside the parentheses are measurement
parameter names used when displaying the measured values.
P-P value (Max – Min) [V]
Max Voltage [V]
Min Voltage [V]
Rms value (1/ n )(Σ(xi)
2
)
1/2
[V]
Average voltage (1/n)Σxi [V]
Standard deviation
(1/n(Σxi
2
– (Σxi)
2
)/n))
1/2
Amount of undershoot
(Low – Min)/(High – Low) × 100 [%]
Amount of overshoot
(Max – High)/(High – Low) × 100 [%]
High voltage [V]
Low voltage [V]
10.6 Automated Measurement of Waveform Parameters

 Loading...