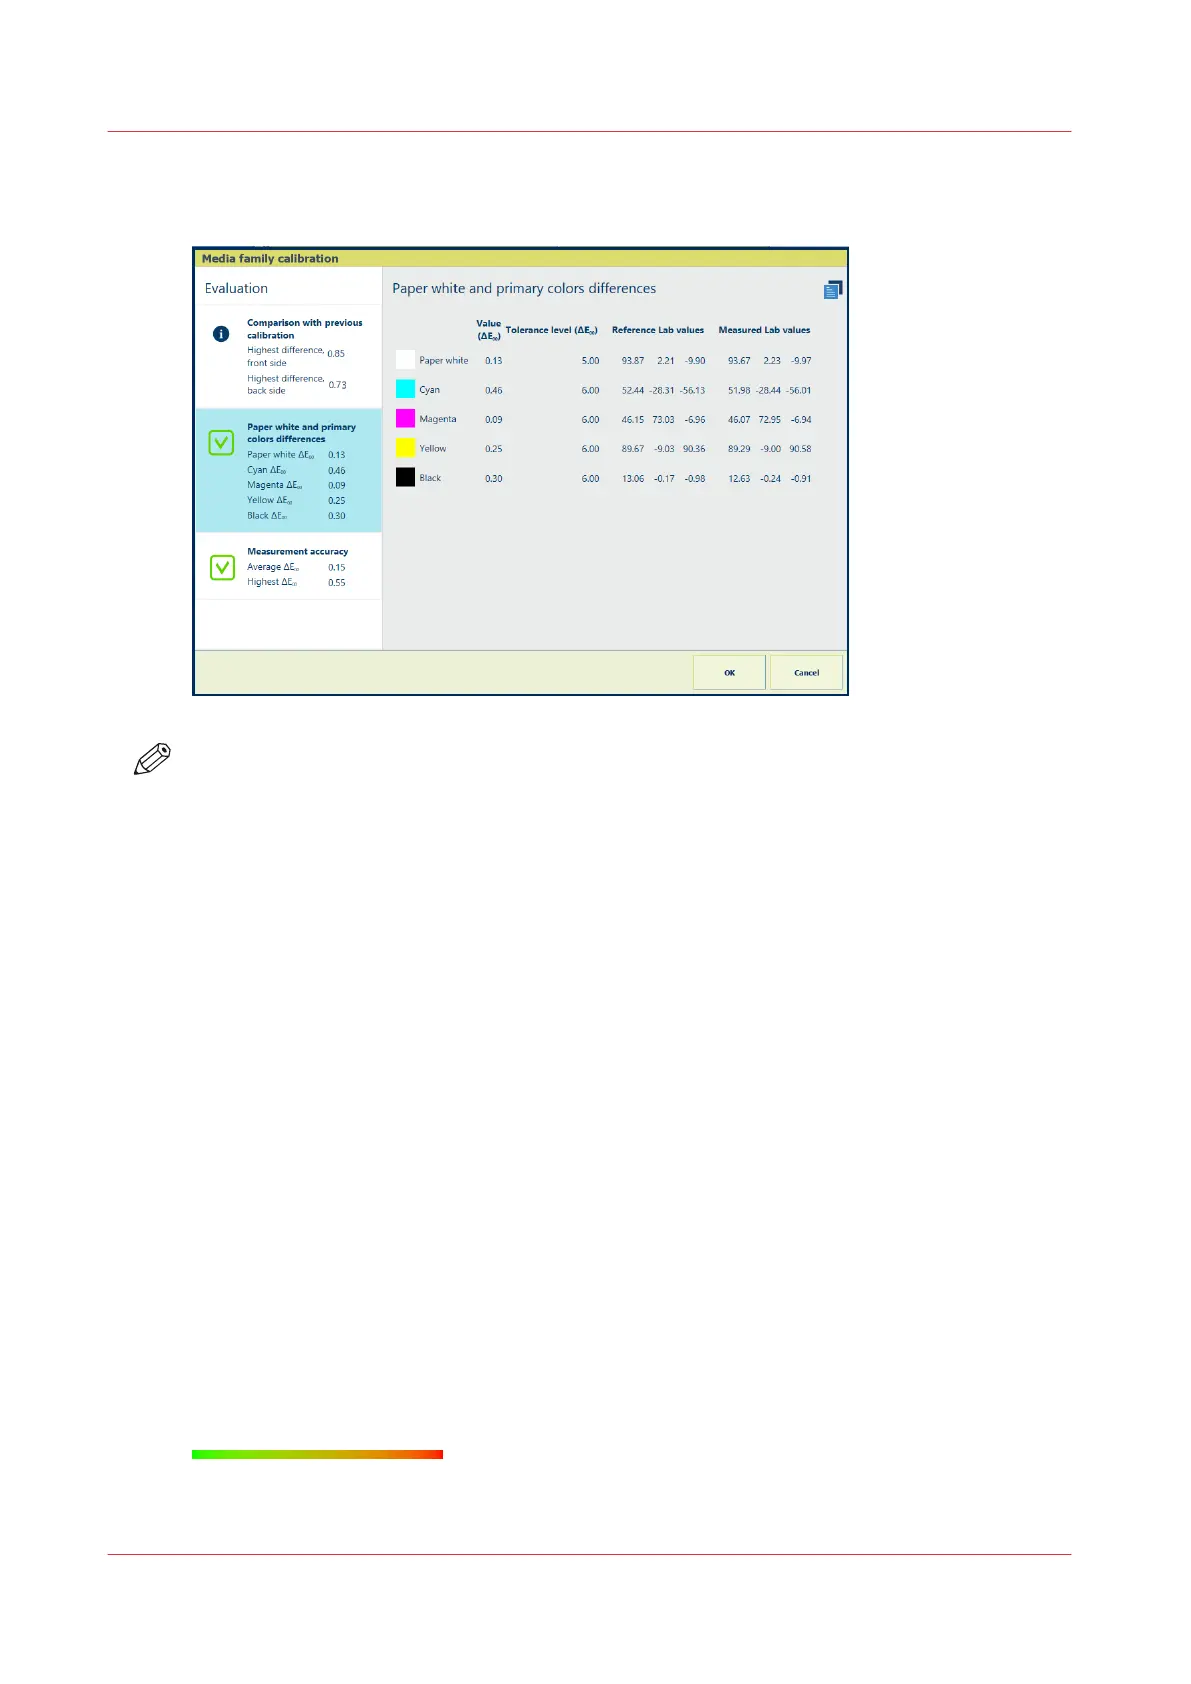
The summary and detailed views show the differences, the measured values, and the reference
color values for both sides.
NOTE
For the first calibration of the media print mode there are no reference values and thus no
feedback information.
Measurement accuracy
The measurement accuracy information indicates if the patches were measured accurately.
Therefore, tolerance levels are used. (
Read tolerance levels for the media family calibration
on
page 231)
Charts must be measured correctly within certain speed limits. Although the calibration wizard
shows what you must measure and when you must redo a measurement, it can still be possible
that your measurements were not performed correctly.
• The summary area shows the average and highest color differences between the measured
and the reference values.
• When you touch the summary area, you see more information. Every measured patch of both
calibration charts are represented in the heatmap. The heatmap indicates how accurate the
measurements of the patches were performed.
When the feedback shows that the measurements were not accurate enough according to the
configured tolerance levels, perform the media family calibration again.
Read the measurement accuracy in the heatmap
The heatmap patches are green, red, or have a gradient between green and red. In this way the
color makes visible which patches are correctly, incorrectly or suspiciously measured. The
tolerance levels set for the media family calibration determine when patches turn red and green.
(
Read tolerance levels for the media family calibration
on page 231)
1. Touch the summary information. The heatmap appears.
Read media family calibration feedback
228
Chapter 9 - Print what you expect
 Loading...