Spectrum Measurements
R&S
®
ESR
457User Manual 1175.7068.02 ─ 12
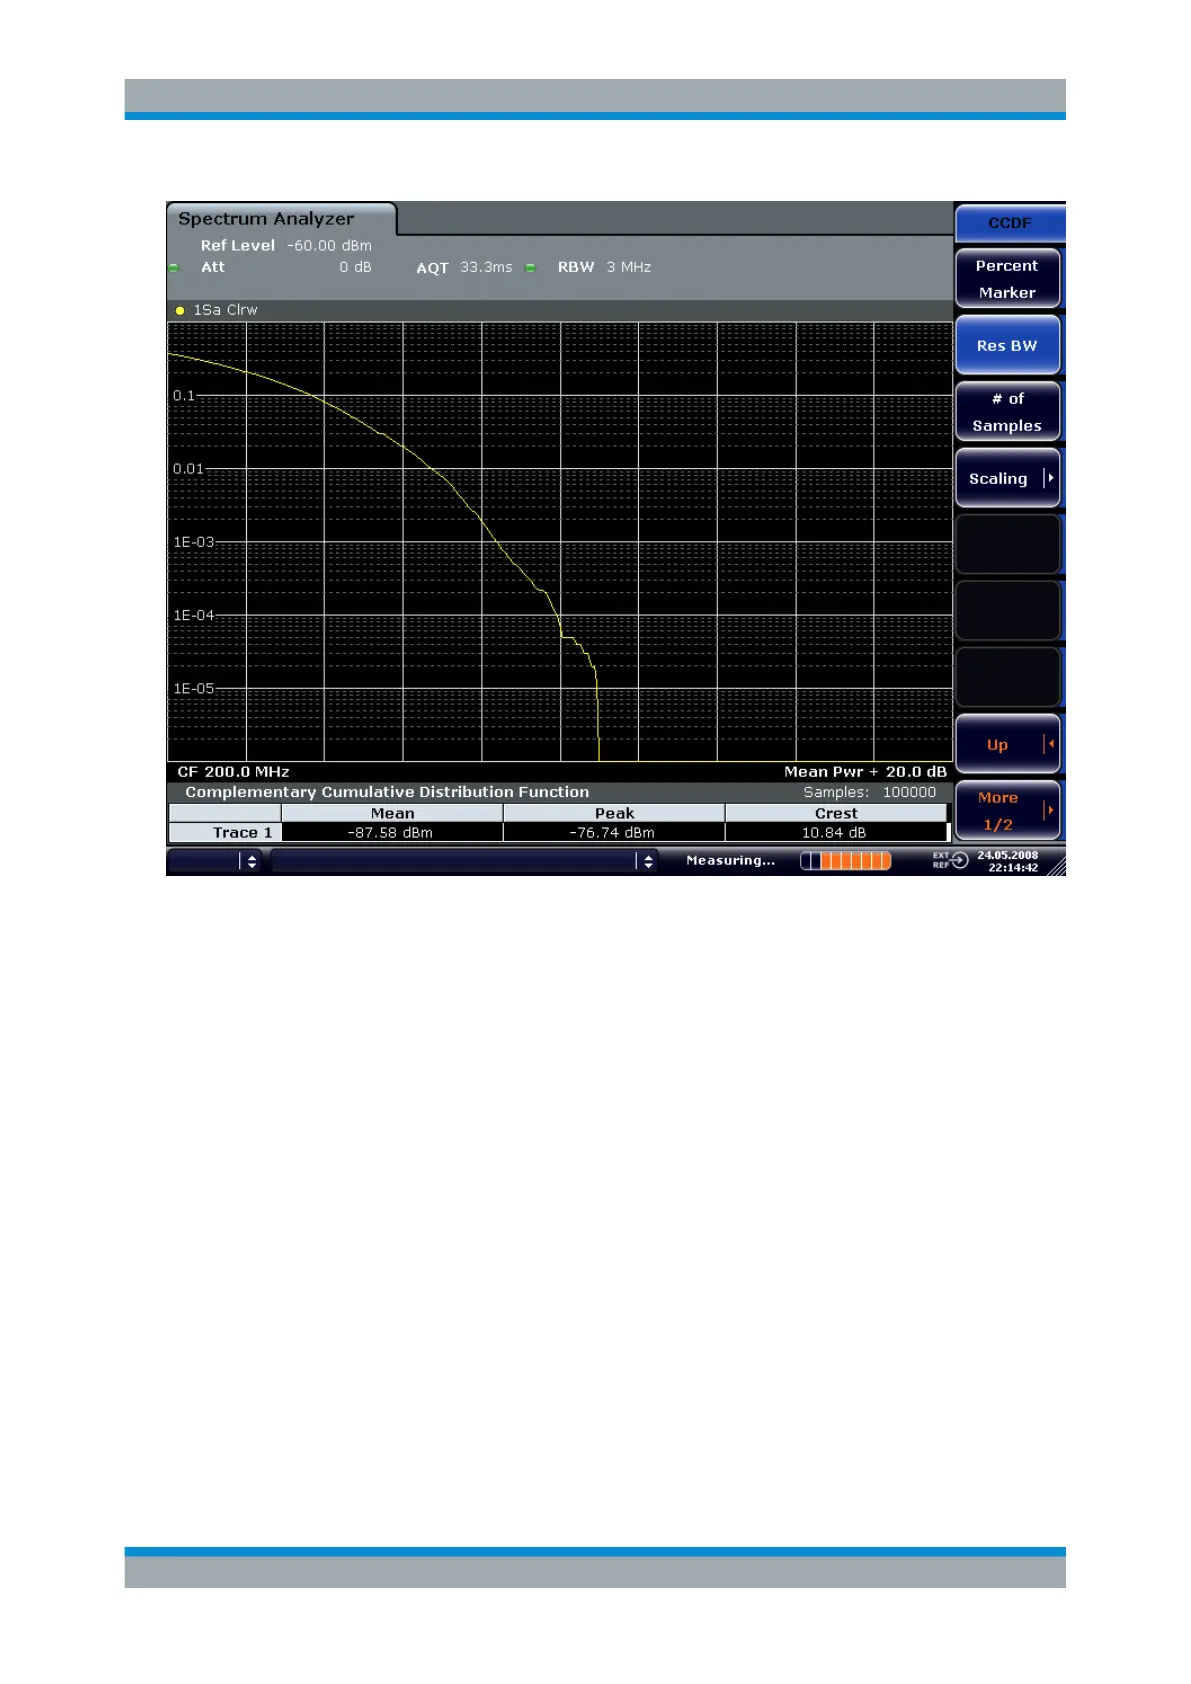
Figure 6-37: CCDF of white noise
The CCDF trace indicates the probability that a level will exceed the mean power. The
level above the mean power is plotted along the x-axis of the graph. The origin of the
axis corresponds to the mean power level. The probability that a level will be exceeded
is plotted along the y-axis.
Advanced Measurement Examples
 Loading...