Procedure
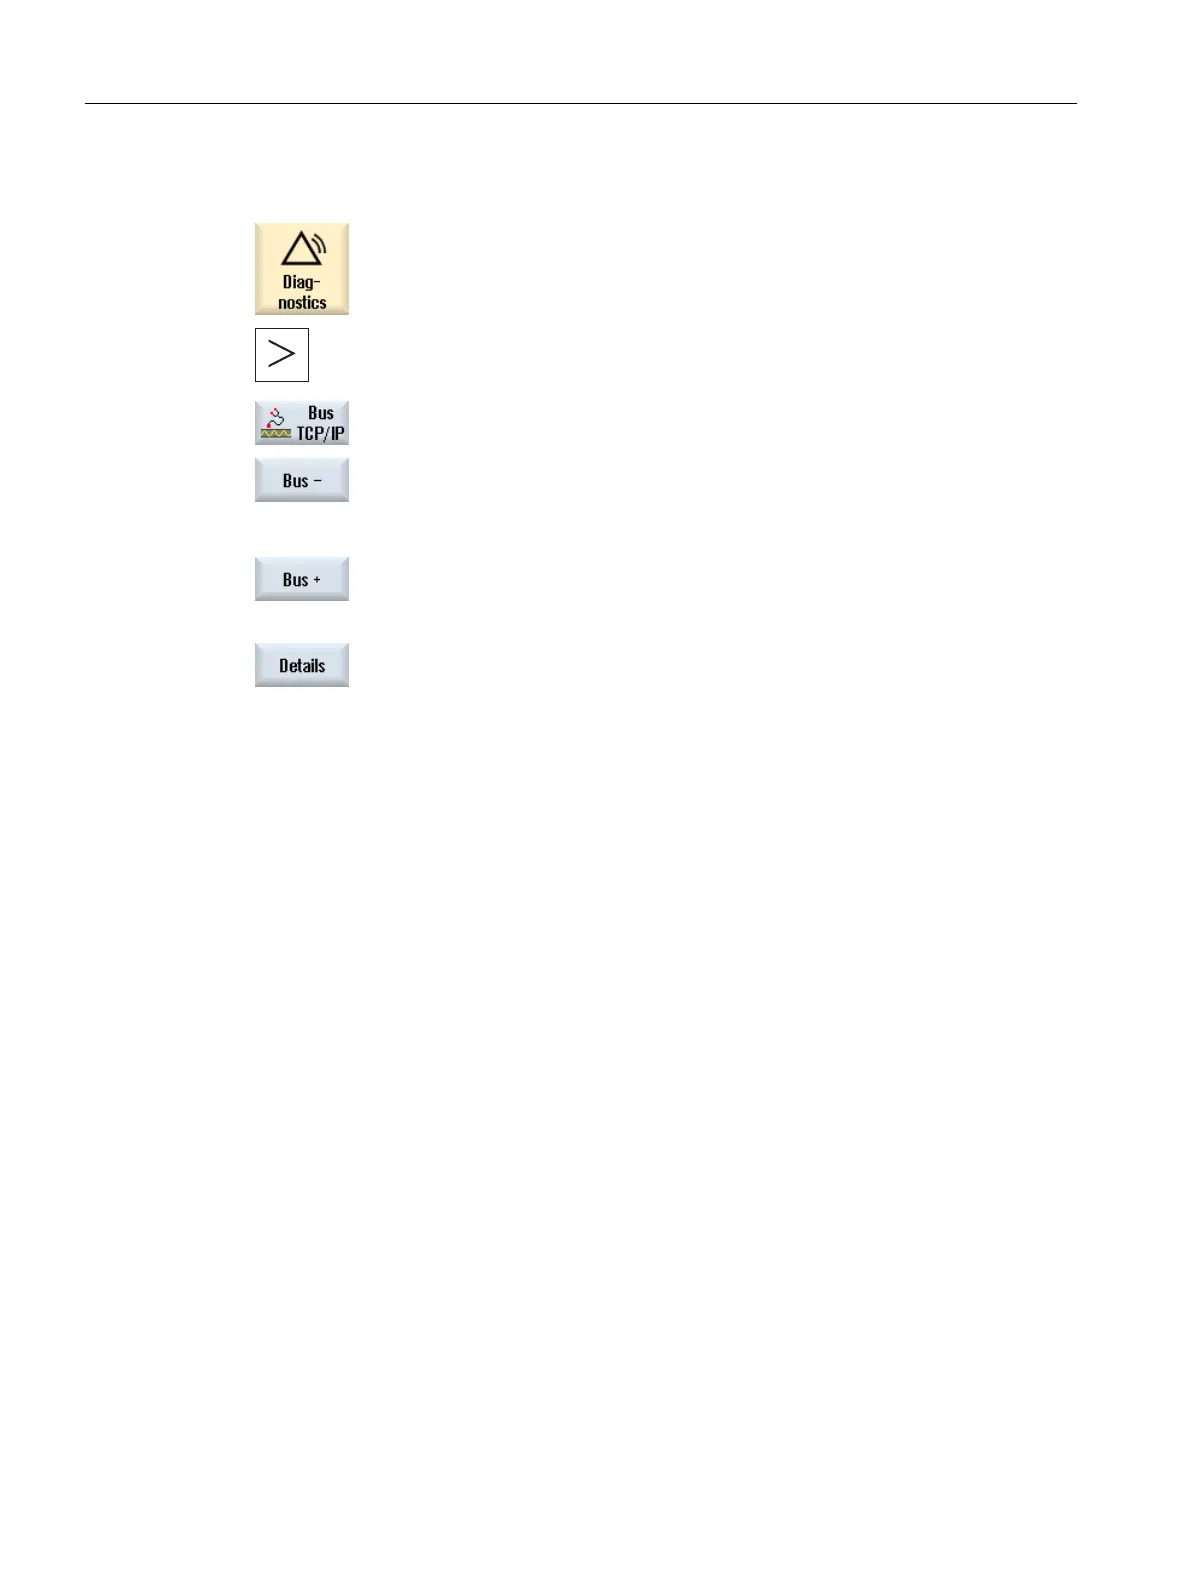
1. Select the "Diagnostics" operating area.
2. Press the menu forward key and the "Bus TCP/IP" softkey.
The "PROFINET/PROFIBUS Diagnostics" window opens.
...
3. Press the "Bus -" or "Bus +" softkey to select the desired bus.
4. Select the PROFINET device for which you want to display details.
5. Press the "Details" softkey.
The "PROFINET Diagnostics ... - Details" window opens.
See also
Accessible nodes (Page 45)
10.4 Trace
The trace
provides you with an oscilloscope function that allows the following data (signals) to
be graphically displayed:
● General NC data
● PLC data
Trace session
The function serves for troubleshooting and resolving faults as well as to analyze the machine
and process performance. In a session, data (signals) are recorded briefly before and after an
event.
Graphic display
The recorded data is optically displayed in the form of curves, the so-called characteristics
graphs.
You have the option of individually setting the recording type.
Saving and downloading data
You can store the recorded data in an XML file. The saved file can then be re-loaded so that
it can be evaluated at a later time.
Service and diagnostics
10.4 Trace
SINUMERIK Operate
344 Commissioning Manual, 10/2015, 6FC5397-3DP40-5BA3
 Loading...