Basically there are two progress bar types:
1. Progress
bars with up to two color changes, e.g. for temperature or utilization display (see
example 6a)
2. Progress bars to display the progress (without color change) in the Operate style (see
example 6b)
Example 6a
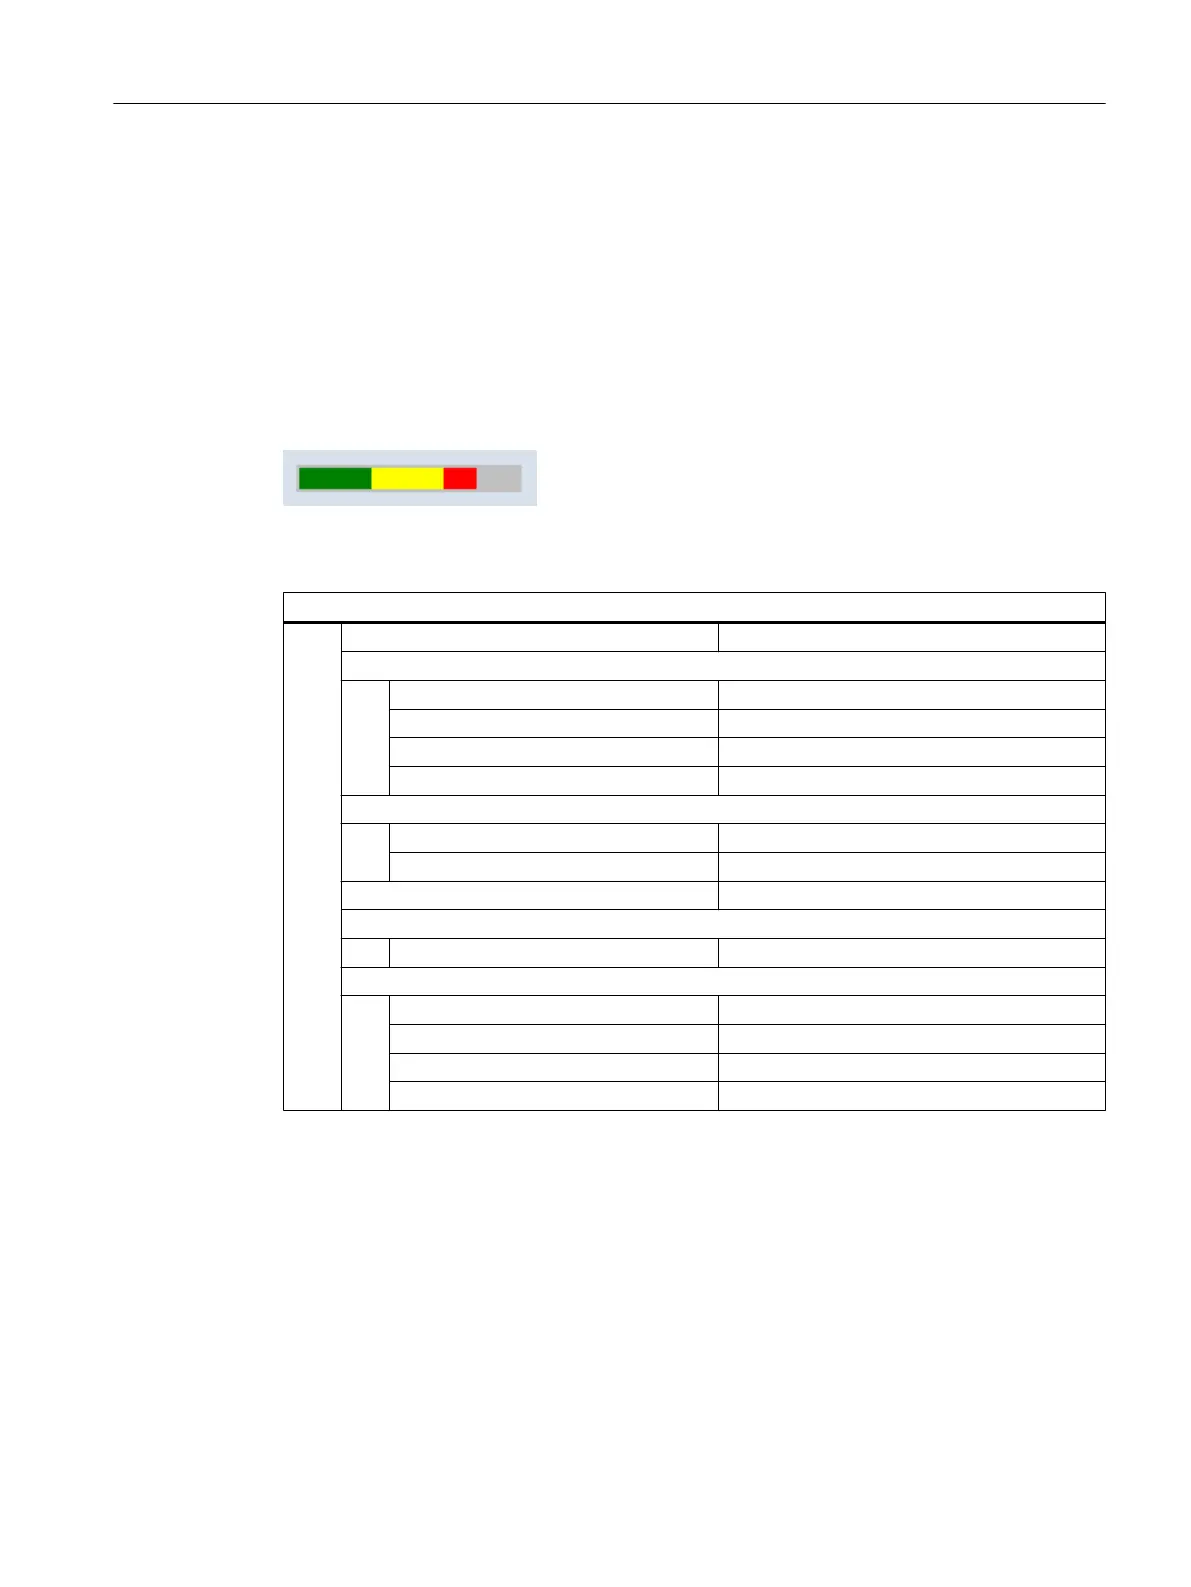
Progress bar with two color changes:
Figure 5-1 Progress bar with two color changes
DEF PROGGY0 = (R/0,150,50,100///DT1,DO0//"$R[10]"//,,150/3,4,,,,,,,9,7)
Variable type: REAL
Limits / toggle field:
MIN: 0
MAX: 150
Signal value SVAL1: 50
Signal value SVAL2: 100
Attributes:
Display mode DT: 1 (progress bar)
Display option DO: 0 (from left to right (default))
System or user variable: $R[10]
Position of input/output field:
Width: 150
Colors:
Foreground color: 3 (dark green)
Background color: 4 (light gray)
Signal color SC1: 9 (yellow)
Signal color SC2: 7 (red)
To use a progress bar with color change, the display mode DT (DisplayType) must be set to
1.
The orientation of the progress bar is determined via the attribute display option DO
(DisplayOption):
0: From left to right (default)
1: From right to left
2: From bottom to top
3: From top to bottom
A
MIN and a MAX value must be specified for the display of the progress bar (in the example
MIN: 0, MAX: 150).
Variables
5.8 Example 6: Progress bar
SINUMERIK Integrate Run MyScreens
Programming Manual, 10/2015, 6FC5397-3DP40-5BA3 67
 Loading...