VM15 User Manual ECG Monitoring
109
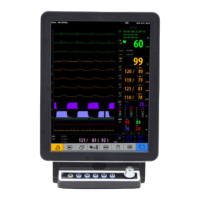
Display of ECG
The below picture shows the ECG Area.
Figure 17-5. ECG Area
ECG Wave
When 3 Lead is selected, one wave is displayed. 3 waves can be changed among Lead I, II, III.
When 5 Lead is selected, 3 waves shall be displayed. 3 waves can be changed into the lead
the user want among Lead I, II, III, aVR, aVL, aVF, V1.
ST Level
ST Level is measured by the horizontal comparison between PR segment and ST segment
which consist of the baseline.
The user can select 8 ST measuring points from J point. (80, 70, 60, 50, 40, 30, 20, 0ms)
This measuring value is only possible with the normal heart beat. Abnormal case (ventricular
ectopy, ventricular tachycardia) and pacemaker shall be excluded from ST analyses.
Figure 17-6. ST Level
VM15 (ST I/ II/ III / aVR / aVL / aVF/ V1) are designed to independently analyze ST Level of
each ECG Lead
For example, Alarm occurs when ST I analyzing value is out of setting alarm range. And the
ST I Level value is blinkering. But the rest of ST Level value shall be not influenced.
WARNING: The criticalness of the increase or decrease of ST Level should be decided by the
medical staffs.