Basic Setup Procedures
User Manual Version 002 BRUKER BIOSPIN 79 (327)
Cross Polarization Setup and Optimization for a Real Solid: Glycine 4.7
Adamantane is highly mobile even in the solid state. Therefore it behaves differ-
ently from a “hard” solid like glycine. For instance, it is not sensitive to decoupling
mis-adjustments, and also not sensitive to miss-sets of the magic angle. It is how
-
ever extremely sensitive to HH misadjustment. Glycine is therefore used for fine
tuning of the decoupling parameters and signal-to-noise assessment. Start with
the parameters found for adamantane, using a 50-100% ramp (ramp.100) and
p15=2 msec for contact, aq = 20 msec. Change the sample from adamantane to
glycine.
Since glycine may exist in two different crystal modifications with very different
CP-parameters, and since packing of the spinner determines crucially the achiev
-
able S/N value, it is useful to prepare a reference spinner with pure α-glycine, fine-
ly powdered and densely packed. α-glycine is prepared by dissolution of glycine in
distilled water and precipitation with acetone, quick filtering and careful drying in a
desiccator. Drying is important because wet glycine may readily transform, espe
-
cially when kept warm, into γ-glycine. α-glycine has two carbons with shifts of
176.03 and 43.5 ppm. γ-glycine shows resonances somewhat shifted to higher
field, sharper lines, longer proton T
1
and shorter proton T
1ρ
which results in longer
experiment time and less signal to noise.
Spin the glycine sample at 5 kHz (7mm spinner), or 10 kHz (smaller spinners 4,
3.2 or 2.5), tune and match the probe.
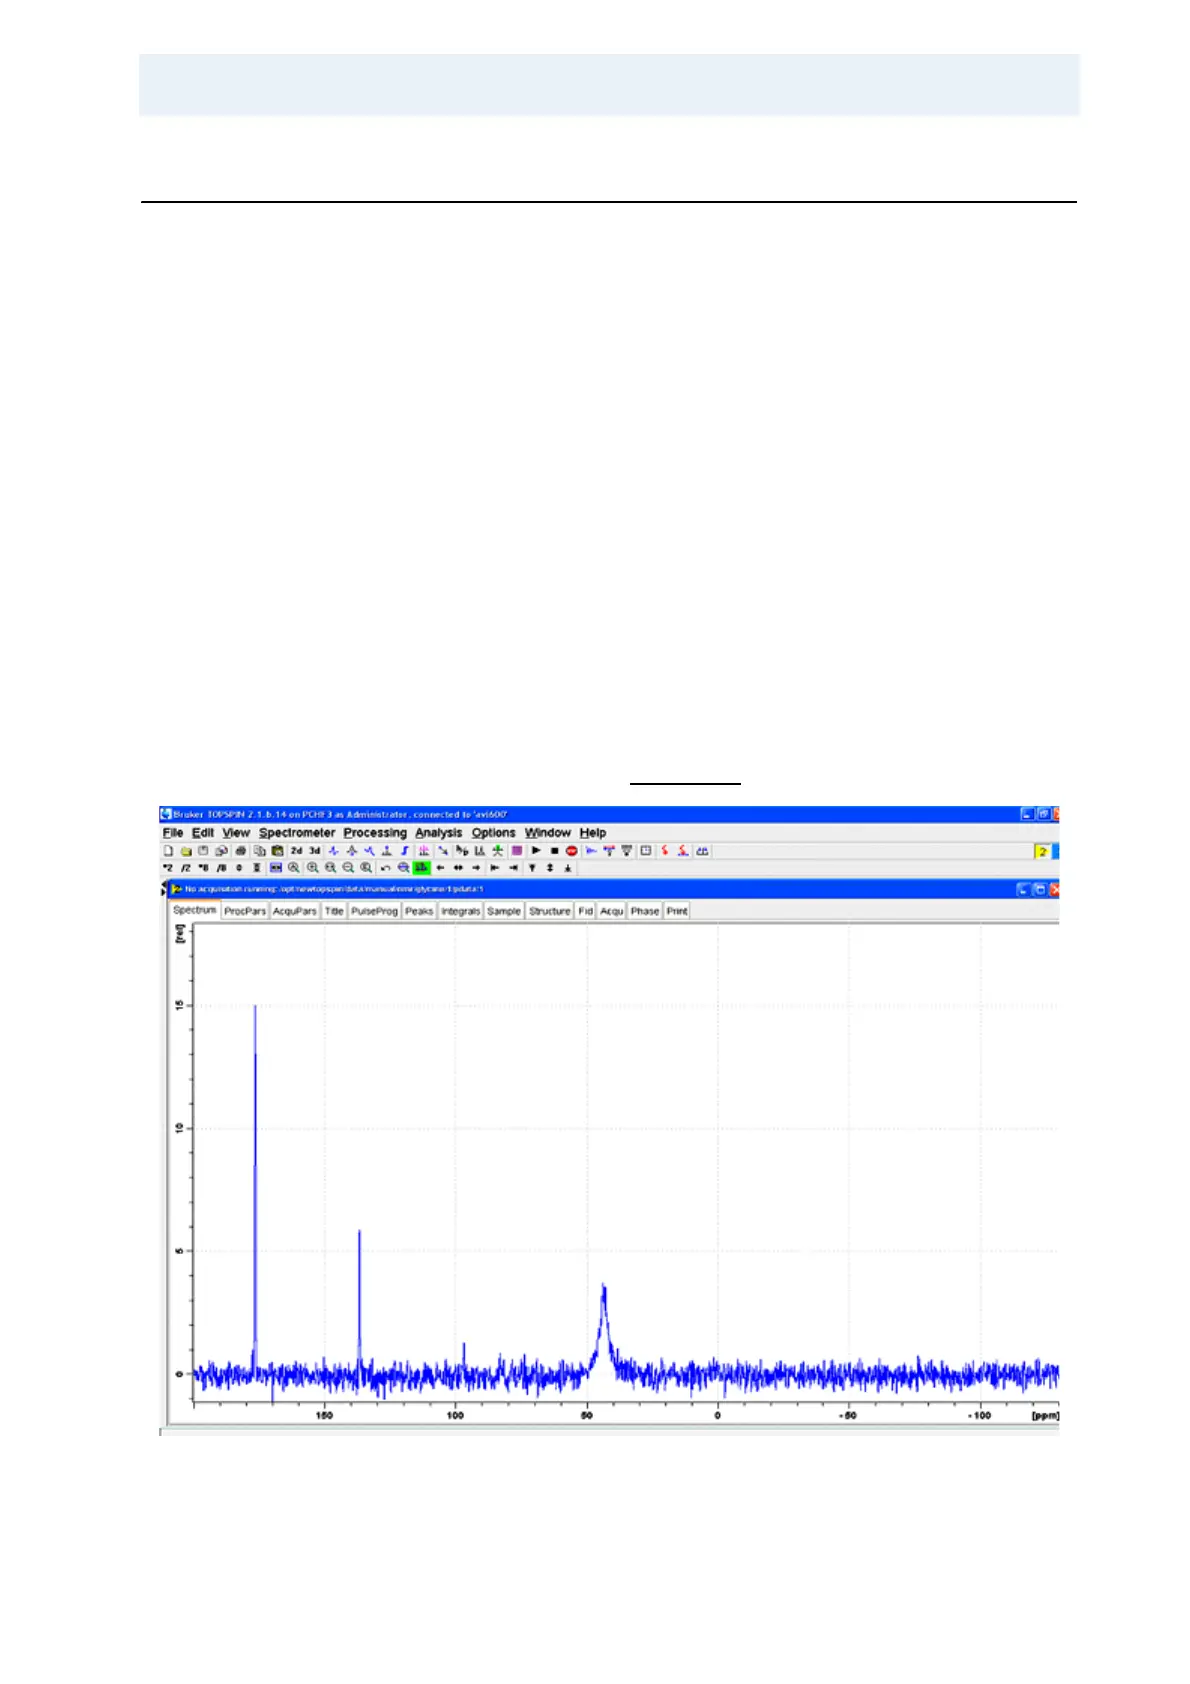
The glycine cp/mas 13C-spectrum taken under the same conditions as adaman-
tane previously will look like in Figure 4.23., far from optimum:
Figure 4.23. Display Showing α-Glycine Taken Under Adamantane Conditions, 4
scans