152 (327) BRUKER BIOSPIN User Manual Version 002
Proton Driven Spin Diffusion (PDSD)
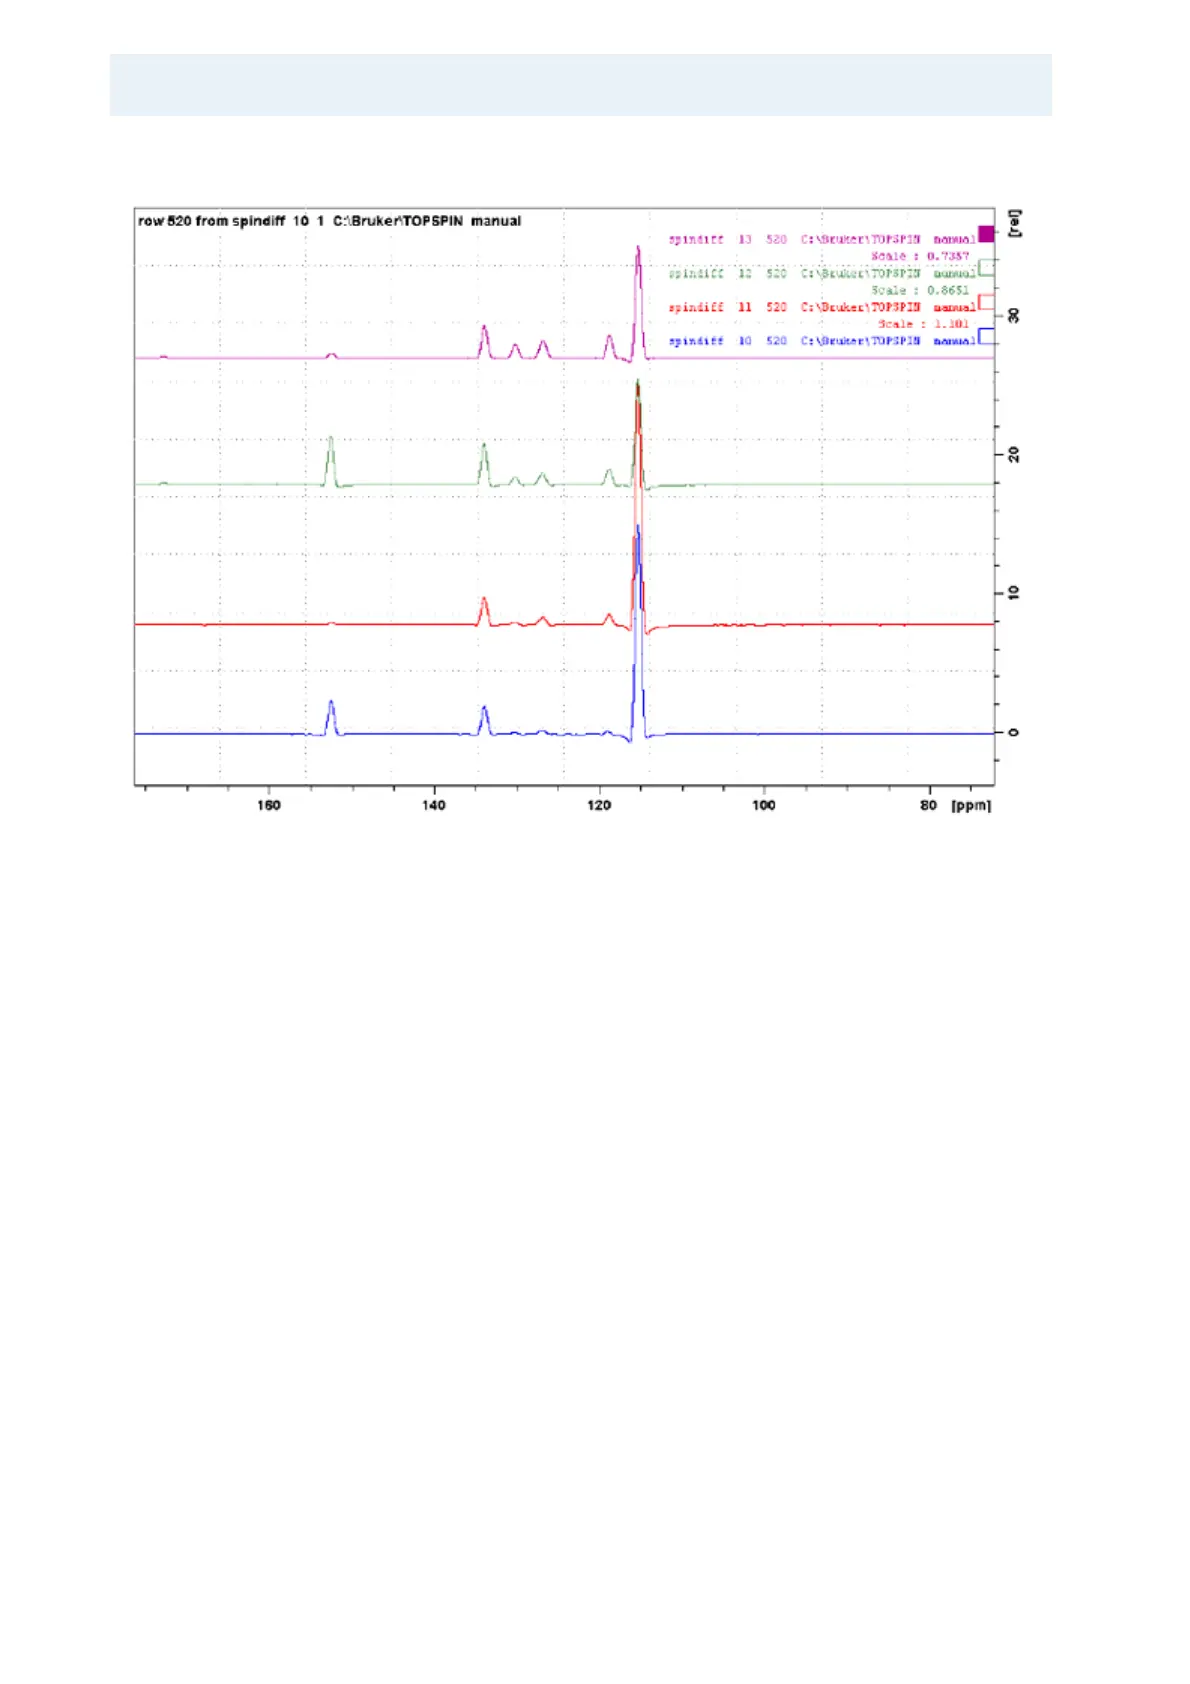
Figure 11.5. Comparison of DARR/PDSD
The figure above is a comparison of DARR/PDSD, with 4.6 and 20 msec mixing
time, sample tyrosine-HCl spinning at 22 kHz. Traces through peak at 115 ppm,
most high field aromatic carbon. Traces from below: DARR at 4.6 msec mix,
PDSD at 4.6 msec mix, DARR at 20 msec mix, and PDSD at 20 msec mix. Note
that some cross peak intensities differ substantially!