CRAMPS 2D
User Manual Version 002 BRUKER BIOSPIN 297 (327)
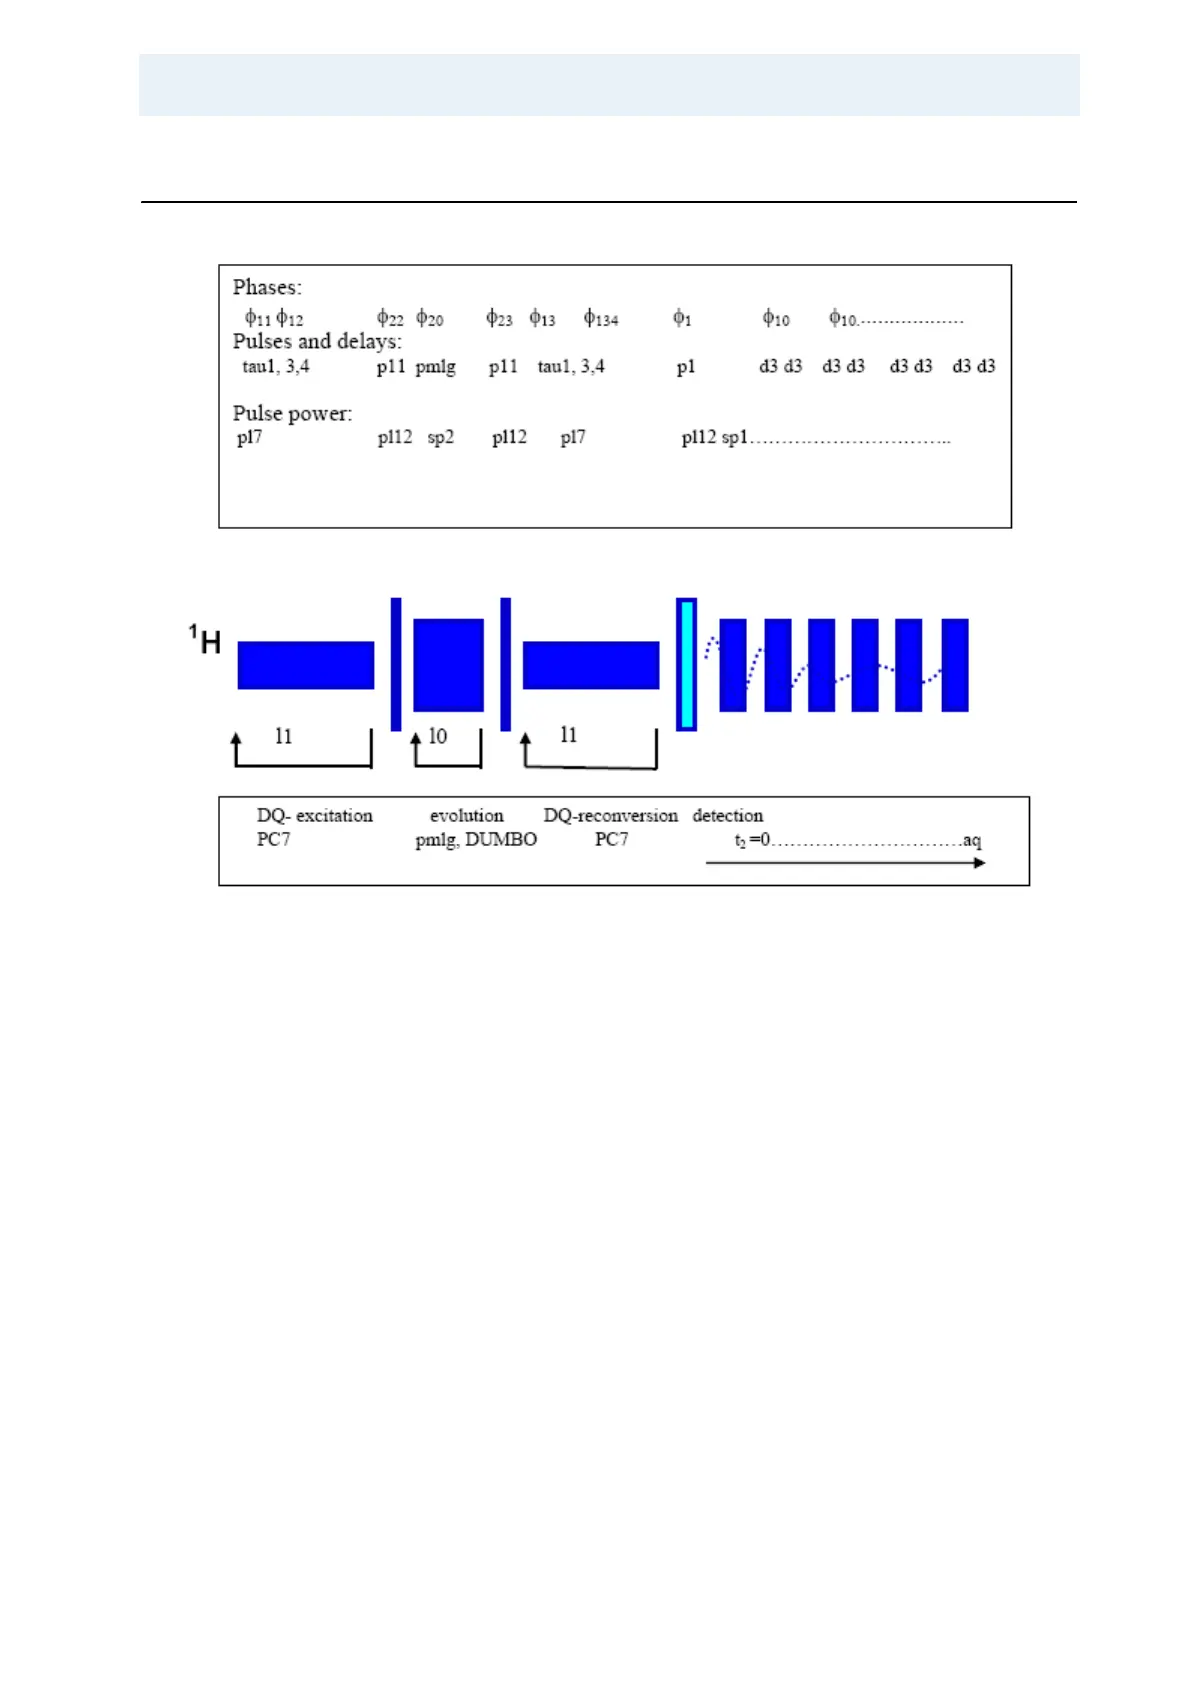
Pulse Sequence Diagram 24.6
Figure 24.5. Pulse Sequence Diagram
When applied to X-nuclei like
13
C, the RF field during this sequence must be care-
fully matched to the 7-fold spin rate, since the dipolar couplings are small, and
care must be taken that the excitation bandwidth of the sequence chosen covers
the whole shift range of the X-nucleus. In the case of protons, this is rather forgiv
-
ing, since the shift range to be covered is small, and the required power levels are
easily achieved for protons. Usually it is enough to calculate the required power
level from the spin rate and the known proton 90 degree pulse using the au pro
-
gram calcpowlev. Assume the spin rate is 14000 Hz and post-C7 is used. The re-
quired RF field is then 7*14000=98000 Hz. The known proton 90 degree pulse is
2.5 µsec=1/4*2.5e-6 =100000 Hz. Type calcpowlev and enter 100000, return,
then enter 98000, return. The output will be “change power level by 0.18 dB”. The
power level for the p-C7 sequence is therefore 0.18 dB to higher attenuation than
what is required for a 2.5 µsec pulse.