112 (327) BRUKER BIOSPIN User Manual Version 002
Basic CP-MAS Experiments
In Figure 7.7. the amplitude of the spinning sidebands are reduced to more than
10% compared to the original spectrum without sideband suppression. 256 tran-
sients were recorded.
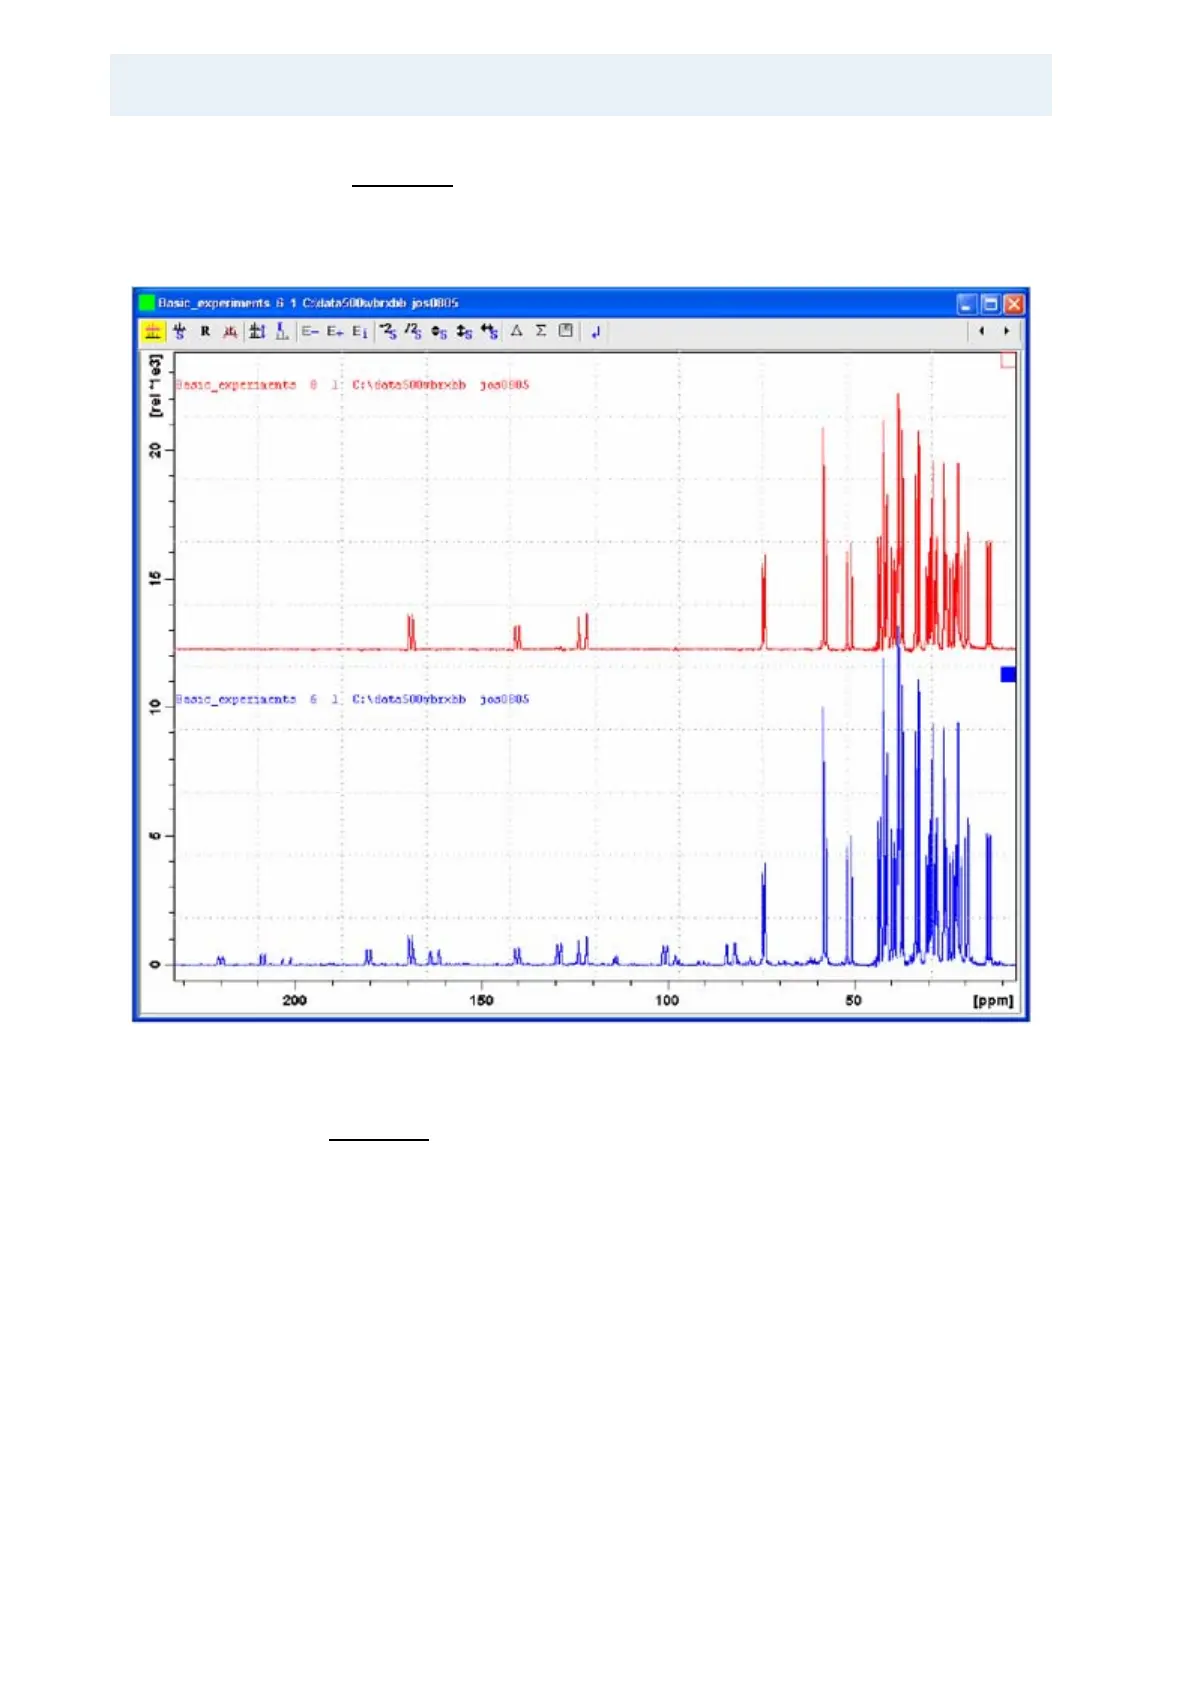
Figure 7.8. Cholesterylacetate Spectrum Using Sideband Suppression
Figure 7.8. is a cholesterylacetate spectrum using sideband suppression with the
SELTICS sequence at 5 Hz sample rotation (upper spectrum). The lower spec-
trum is the CPMAS spectrum at 5 kHz sample rotation.