Basic MQ-MAS
User Manual Version 002 BRUKER BIOSPIN 217 (327)
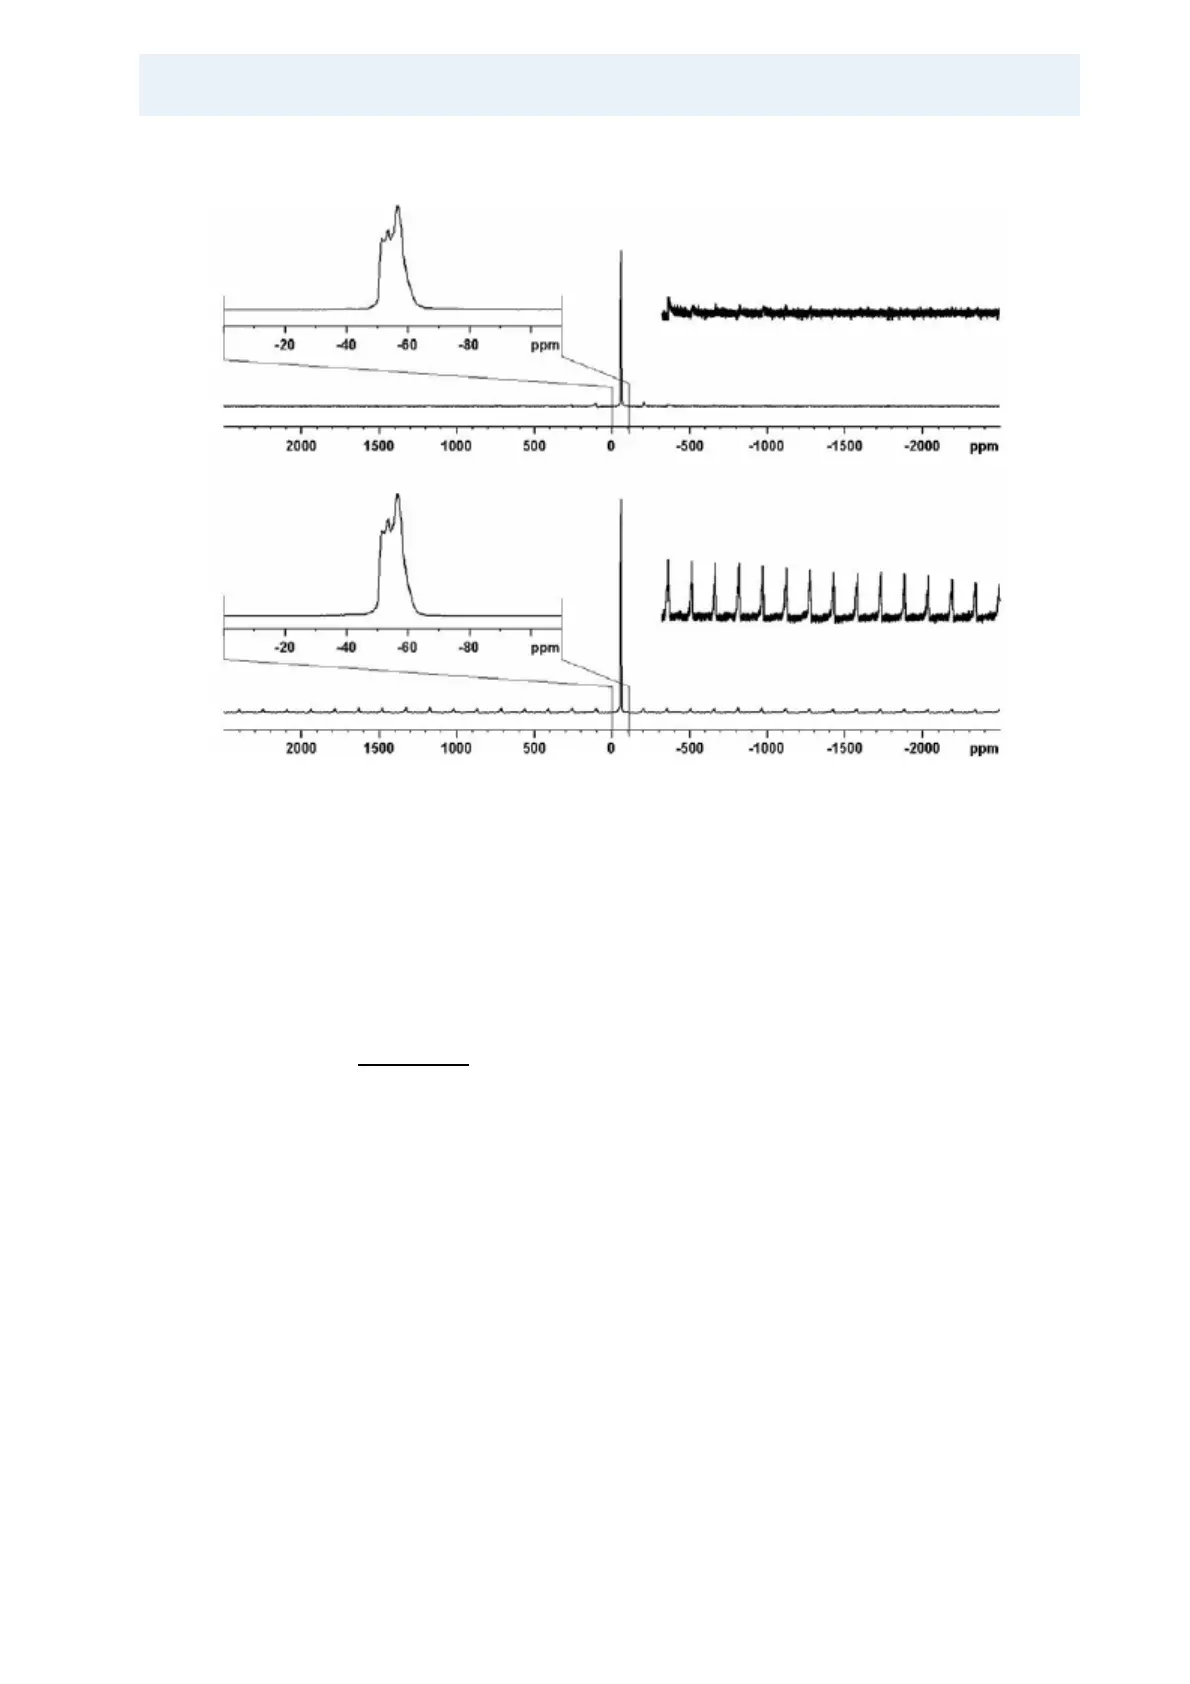
Figure 17.3. Comparison of 87Rb MAS spectra of RbNO3 excited with selective
and non-selective pulses.
The lower trace is a spectrum excited with a 1 µs non-selective pulse correspond-
ing to a small flip angle. Above is a spectrum excited with a 20 µs selective 90°
pulse. Note that in the latter no spinning side bands from the satellite transition
are observed. Spectra are taken on AV500WB at a Larmor frequency of 163.6
MHz with a 2.5 mm CP/MAS probe spinning at 25 kHz.
Figure 17.4. shows the nutation profiles of a non-selective and a selective pulse,
respectively. Note that for the selective pulse a fairly precise 180° pulse of a
length of 2*τ
90°
can be determined whereas for a non-selective pulse this is not
the case.