Basic MQ-MAS
User Manual Version 002 BRUKER BIOSPIN 229 (327)
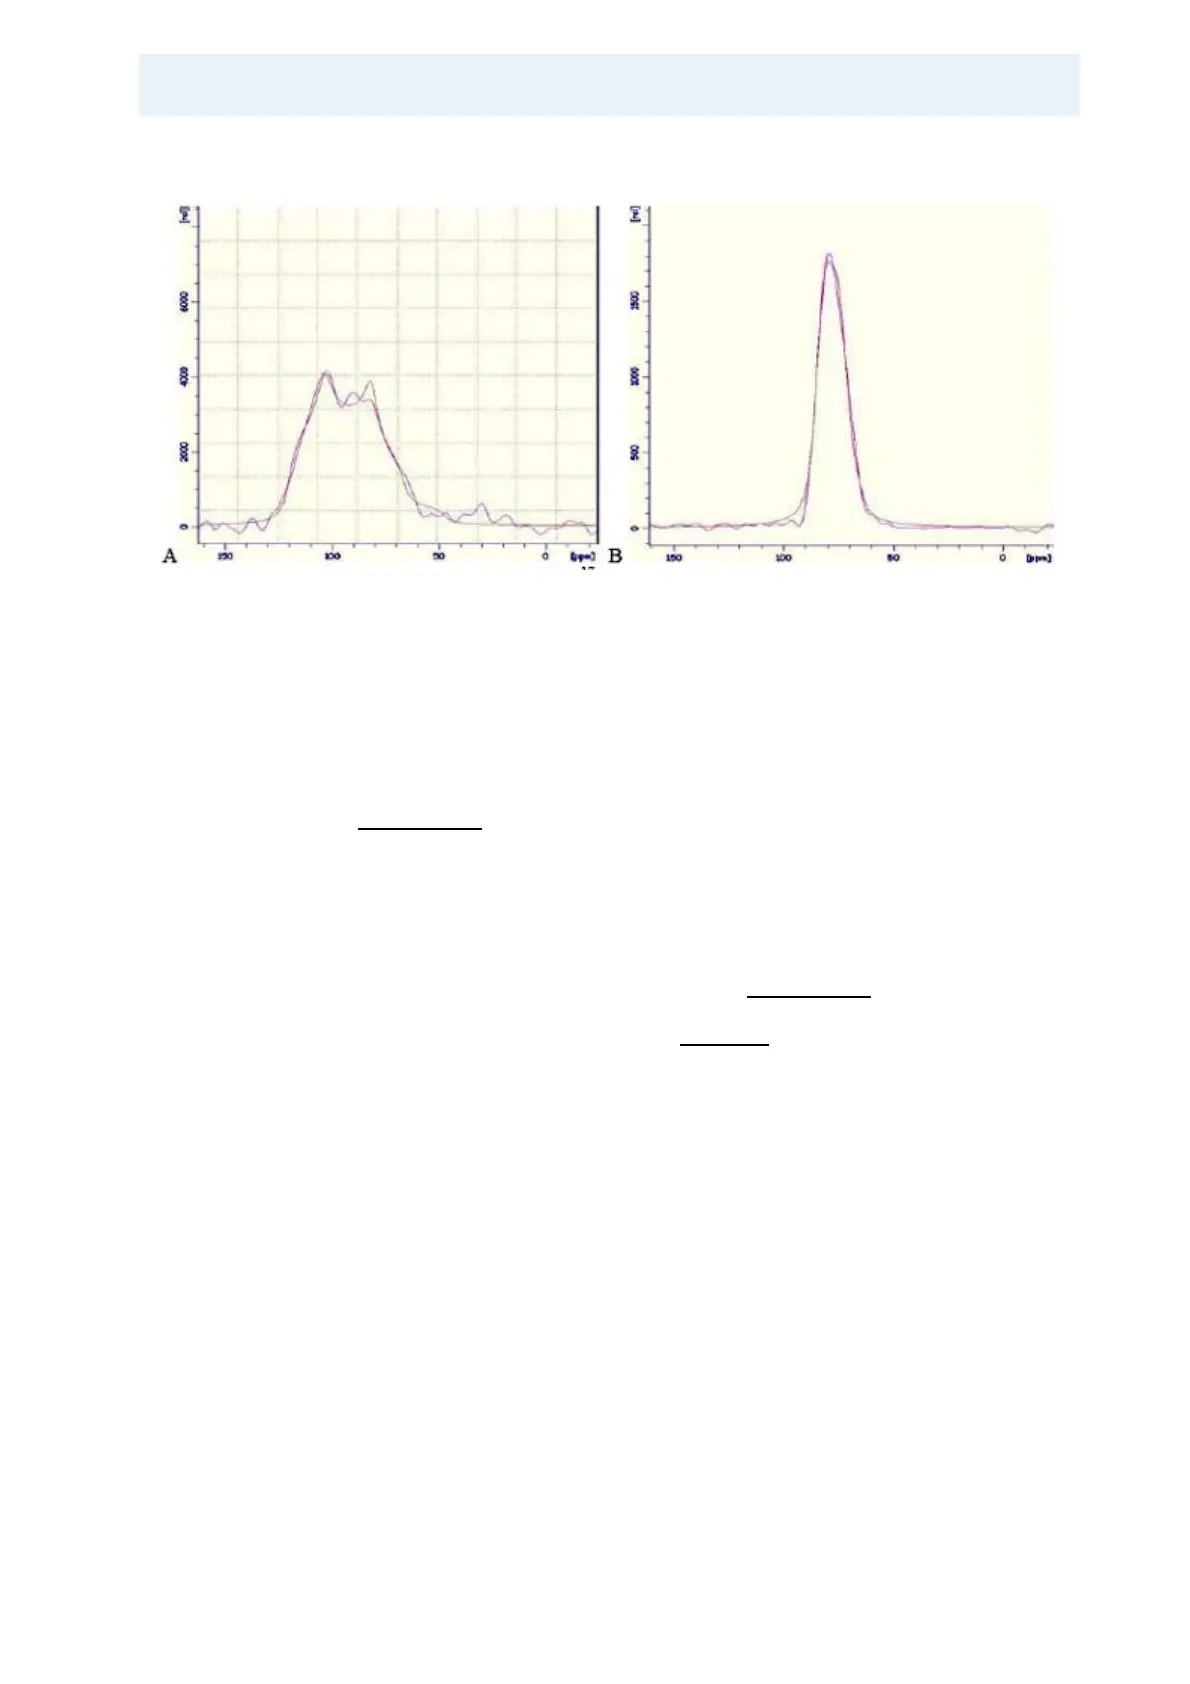
Figure 17.11.Slices and Simulations of the 18.8 T
17
O MQMAS of NaPO3.
Fitted parameters are A) Qcc ≈ 7.7 MHz, h ≈ 0.36, diso ≈ 125 ppm and B) Qcc ≈
4.5 MHz, h ≈ 0.16, diso ≈ 87 ppm for the upper peak (sample courtesy of Alexan
-
drine Flambard, LCPS, Univ. de Lille).
Spectra that are sheared can be evaluated graphically as follows, as shown in
Figure 17.12.. In addition to the (red) isotropic chemical shift axis indicated as
“axis CS” with the slope (F2)/ (F1) = 1 there are two more lines drawn. The
(blue) axis indicated as “axis Qis” is the quadrupole induced shift axis with the
slope
(F2)/ (F1) = -17/10. This axis is identical for all different spins I and all
orders p of the MQMAS experiments. This axis can be shifted, retaining the same
slope, so that it intersects a spectral line in its centre of gravity. Through the inter
-
section point of the Qis axis with the CS axis a third line can be drawn parallel to
the F2 axis. This is the dotted black line in
Figure 17.12.. The shift value that is
read from the F1 axis at this position is the isotropic chemical shift of that particu-
lar site, and the Qis is then given by (Eq. 17.2).