166 (327) BRUKER BIOSPIN User Manual Version 002
REDOR
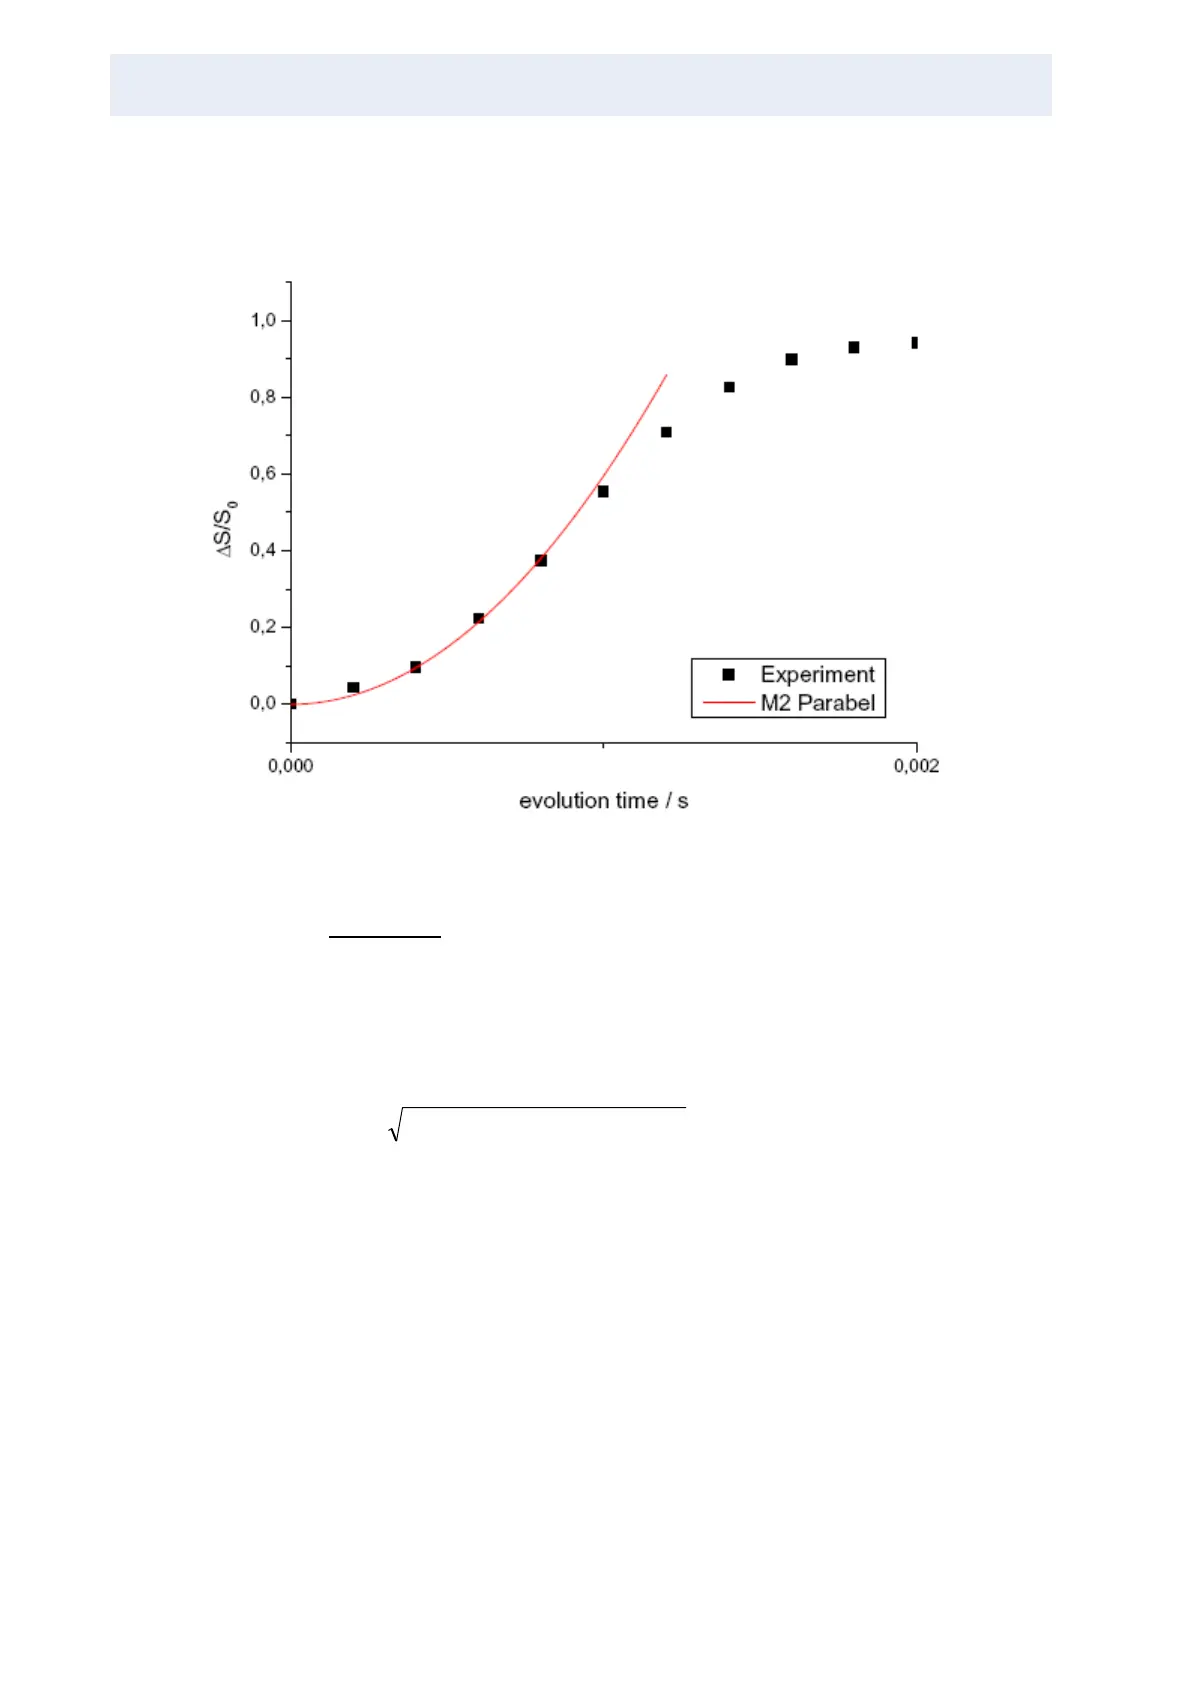
ed curves are calculated using the second moment approach, in order to
demonstrate the error margins you have to expect by the M
2
approach.
Figure 12.9. Experimental data with the corresponding M
2
parabolic analysis.
Figure 12.9.
shows the calculated parabola for the experimental data set. As you
can see in the corresponding table the experimental setup reflects the theoretical
M
2
within an error margin of 40% while this transforms to an overall distance error
of about 10%.
Afterwards the calculated M
2
can be transformed into the dipolar coupling con-
stant by using:
(Eq. 12.4)
The comparison of the second moment directly calculated from the experimental
data with the second moment extracted from the best fitting S
IMPSON simulation,
gives you in this example 747 Hz compared to 850 Hz. Of course this result can
be improved by introducing more data points within the interpretation region of the
parabolic fit, which can easily be done by running the experiment again with high-
er spinning speeds. Afterwards the data sets can be combined before running the
interpretation process.
2
2
M)15.0/(5.0/)16/(15 ⋅+⋅
π