80 (327) BRUKER BIOSPIN User Manual Version 002
Basic Setup Procedures
The figure above shows α-glycine taken under adamantane conditions, 4 scans:
Incorrect carrier setting, α-carbon at 43 ppm insufficiently decoupled. Angle is set
correctly, because carboxyl peak at 176.03 ppm shows a narrow lorentzian line
shape. HH condition looks okay.
Now reset the carrier as shown in Figure 4.13.. o1p should be around 100 ppm,
in the middle of most carbon spectra. Acquire a spectrum, set the plot limits (Fig-
ure 4.14., Figure 4.15.) for the peak at 43 ppm, and start popt, optimizing o2 for
maximum signal (+/- 2000 Hz around the current position) in steps of 500 Hz. The
following result will be obtained:
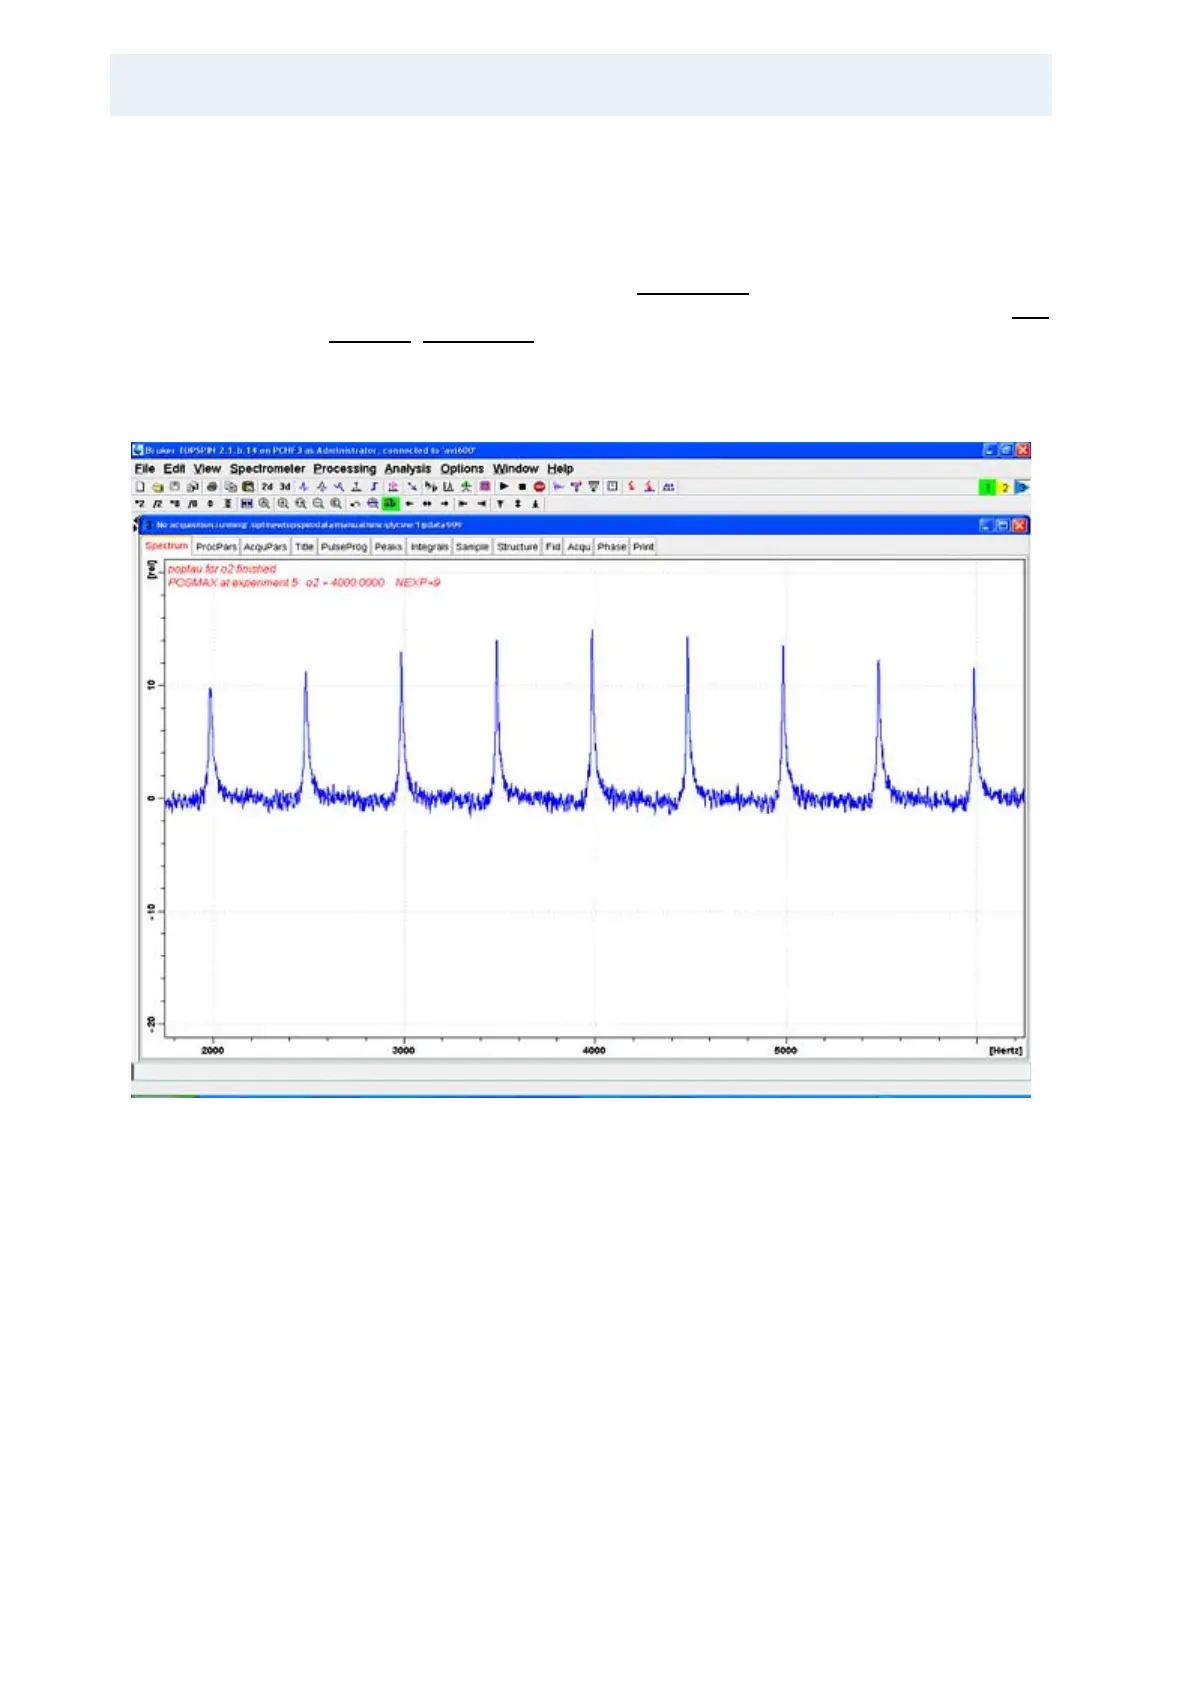
Figure 4.24. Optimization of the Decoupler Offset o2 at Moderate Power, Using
cw Decoupling
Since the proton spectrum of glycine extends around 5 ppm, the optimum decou-
pler offset will be obtained at higher frequency than the adamantane proton peak
(around 1.2 ppm). Decoupling is still inefficient, since cw decoupling is used which
does not cover the whole proton shift range. Also decoupling power is too low with
a proton pulse of 4.5 µsec. Glycine requires about 90 kHz of decoupling RF, corre
-
sponding to a 2.7 µsec proton 90 degree pulse. This can be obtained with probes
of 4mm spinner diameter and smaller (2.5, 3.2 mm). For a 7 mm probe, 3.5
(4µsec) can be expected at proton frequencies below 500 (at 500) MHz. Use cal
-
cpowlev to calculate the required power level pl12 and set p3 to twice the ex-
pected proton pulse width. Check with 4 scans whether a close to zero signal is
obtained. Compared to 4.5 µsec, a 2.7 µsec pulse requires about 4.5 dB more
power (corresponding to almost 4 times more power!!!).