Relaxation Measurements
User Manual Version 002 BRUKER BIOSPIN 207 (327)
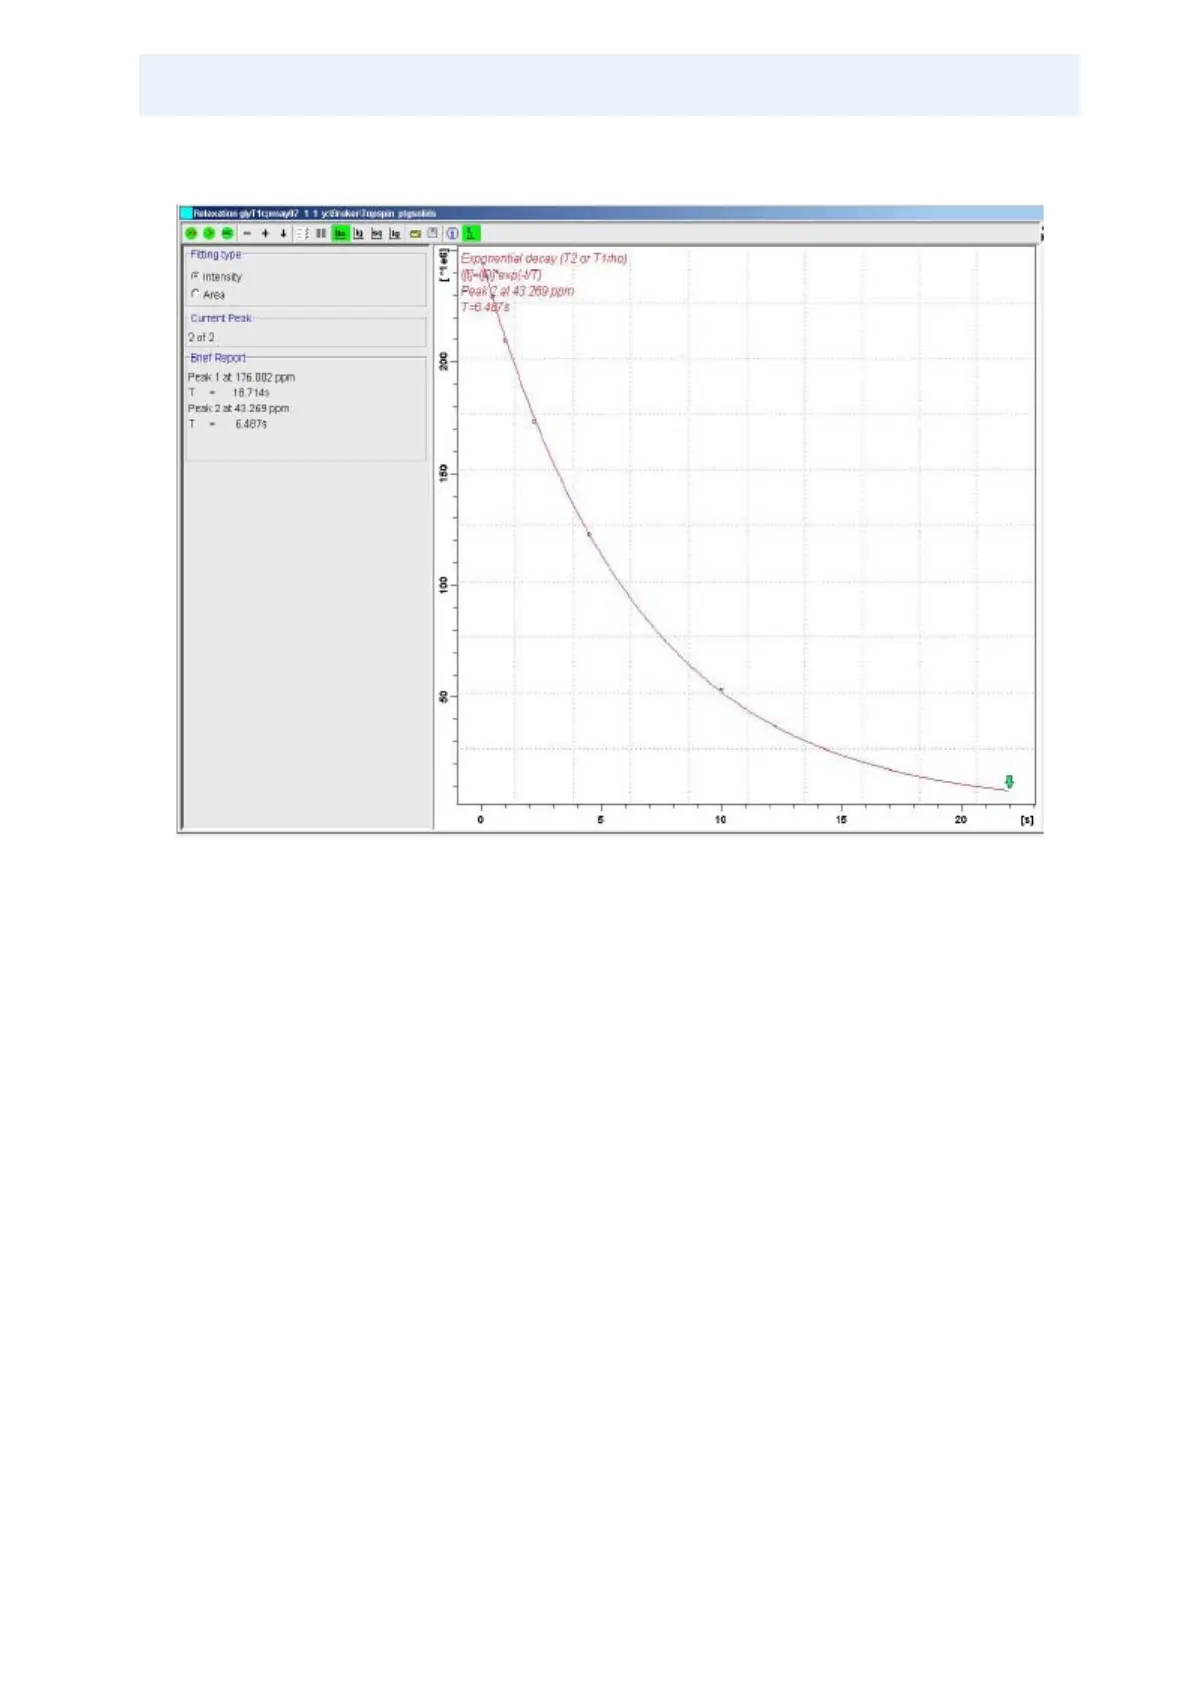
Figure 16.2. Relaxation of Alpha-carbon Signal in Glycine
Start calculation: This will perform the fitting procedure for all regions. The calcu-
lated function is displayed as a red line on the same axes as the data points. The
plus and minus icons can be used to move through the different regions. If you
wish to change whether the fit is based on the integral or the intensity, select the
appropriate radio button, and repeat the fit using the icons immediately above.
The >> icon will fit all the peaks, the > icon will fit just the current one.
Display report: This displays a text report of the results of the fit, including the de-
tails of the fit function, and the calculated values of the parameters in the function.
The experimental and calculated data points are also displayed. Note that the ex
-
perimental data is normalized such that the most intense point has a value of 1.
This report file is also saved in the processed data directory when the fit is calcu
-
lated. If fitting of a single peak is performed, only this result is written to the report.
If the ‘fit all peaks’ option is used, all results will be stored.
The results for glycine at 500 MHz and room temperature should be approximate-
ly 18.5s and 6.4s for the carbonyl and alpha-carbon signals respectively - at other
field strengths the numbers will be somewhat different. If the signals are really un
-
dergoing mono exponential relaxation, the curve should be a good fit to the mea-
sured data.