150 (327) BRUKER BIOSPIN User Manual Version 002
Proton Driven Spin Diffusion (PDSD)
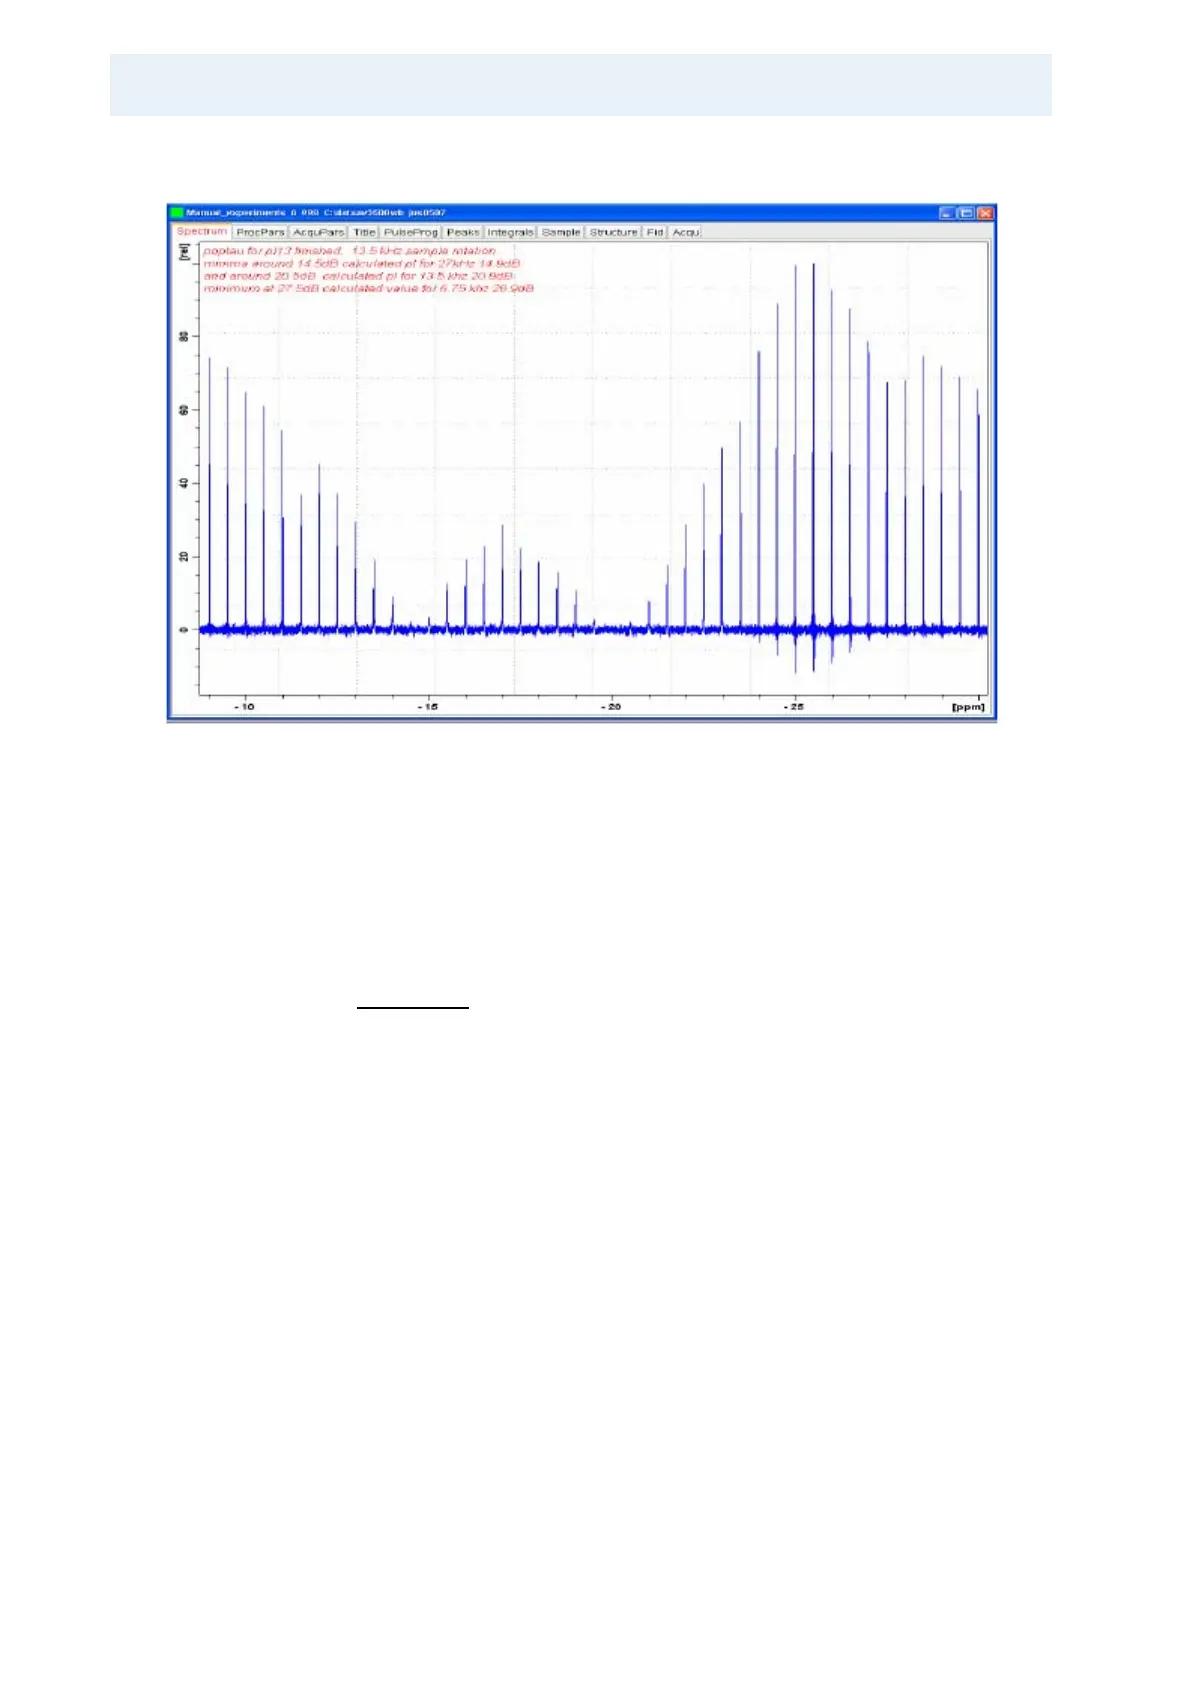
Figure 11.3. POPT Result for the cw Decoupling Power Variation
The figure above shows the POPT result for the cw decoupling power vari-
ation from about 50 kHz RF field to about 5 kHz RF field, spinning the ada-
mantane sample at 13 kHz. The minima at 14.5 and 20.5 dB indicate the n
= 2 and n = 1 RR conditions (26 and 13 kHz RF field).
4. Vary the decoupler power level pl12 used with cw decoupling as indicated in
Figure 11.3. from a power level value pl12 1 dB below the calculated n = 1
condition to 1 dB above the calculated n = 2 condition. Bandwidth consider-
ations favor the n = 2 condition, sample heating considerations favor the n = 1
condition. An RF field of 2 × proton chemical shift range is on the safe side.
5. Enter the power level determined above as pl14 recoupling power for DARR or
RAD.
6. Using DARR or RAD shorter mixing times are possible.