220 (327) BRUKER BIOSPIN User Manual Version 002
Basic MQ-MAS
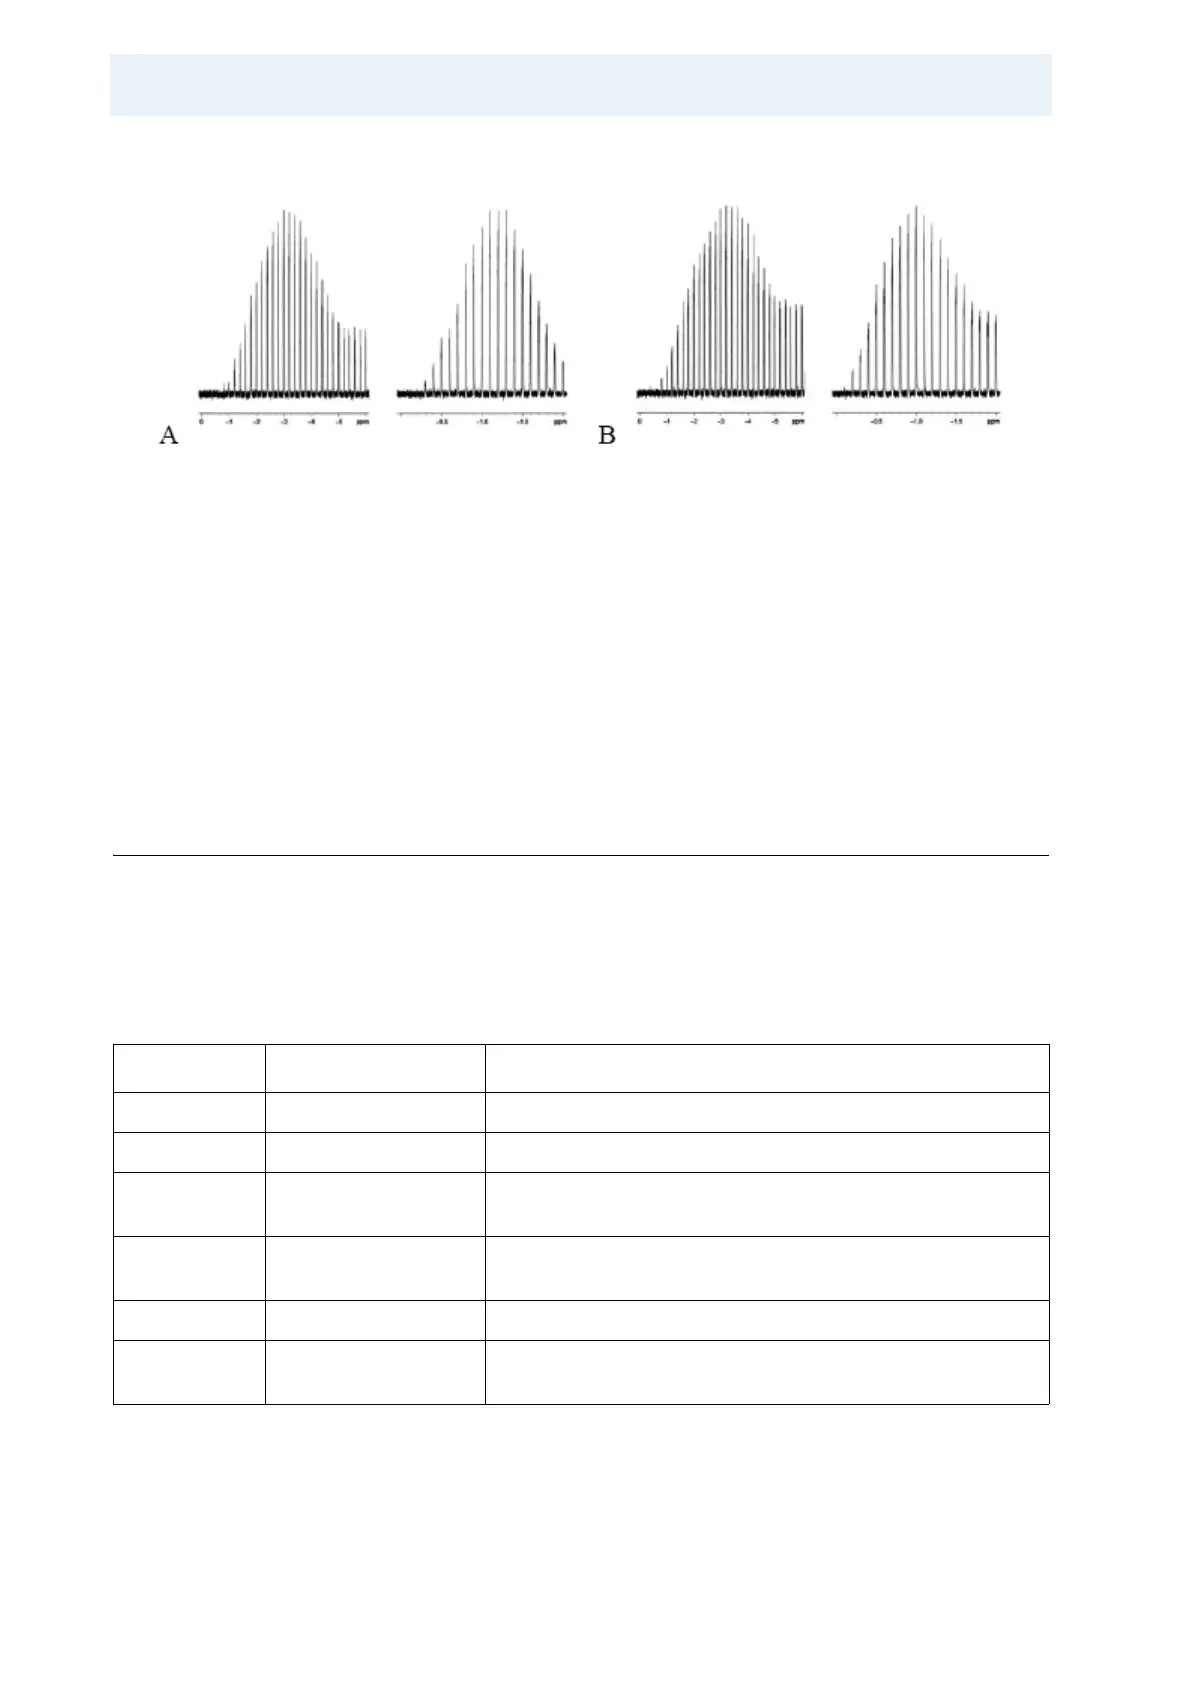
Figure 17.6. Signal Intensities of 87Rb Resonances in RbNO3 as Function of p1
and p2.
Each pair of diagrams in A and B shows the signal intensities as function of the
excitation pulse p1 and the conversion pulse p2. In A the 3-pulse sequence and in
B the 4-pulse sequence was used. Note that the signal intensity is much more
sensitive to the proper length of the conversion pulse. Maximum intensities were
3.0 µs and 1.2 µs in A and 3.2 µs and 1.0 µs in B, respectively. This corresponds
to approximate RF field amplitudes of 160 kHz. Spectra are taken on an
AV500WB at a Larmor frequency of 163.6 MHz with a 2.5 mm CP/MAS probe
spinning at 25 kHz. Note the different scaling of the x-axes, for p1 they range from
0 to 6 µs, for p2 from 0 to 2 µs.
Two Dimensional Data Acquisition 17.3.2
Once the pulses are calibrated everything is ready for the 2D data acquisition.
Create a new data set and change parmode to 2D. In the acquisition parameters
for the (new) indirect F1 dimension the following parameters must be set accord
-
ing to the following table.
1
Note the difference in increment handling in Topspin 2.1 and higher.
Table 17.3. F1 Parameters for 2D Acquisition
Parameter Value Comments
FnMode States or States-TPPI Acquisition mode for 2D.
TD see text Number of FID’s to be acquired.
SWH “masr” Equals spinning frequency for rotor synchronization, from this
IN_010 is calculated correctly, if ND_010 is already set.
NUC1 Select the same nucleus as for F2 so that transmitter fre-
quency offset is correctly set (important for referencing).
1
D10 0 Used in mp3qzfil.av only.
IN10 =in0*7/9 Used in mp3qzfil.av for nuclei with spin I=3/2 only, so that no
shearing FT is required.