Setup
User Manual Version 002 BRUKER BIOSPIN 161 (327)
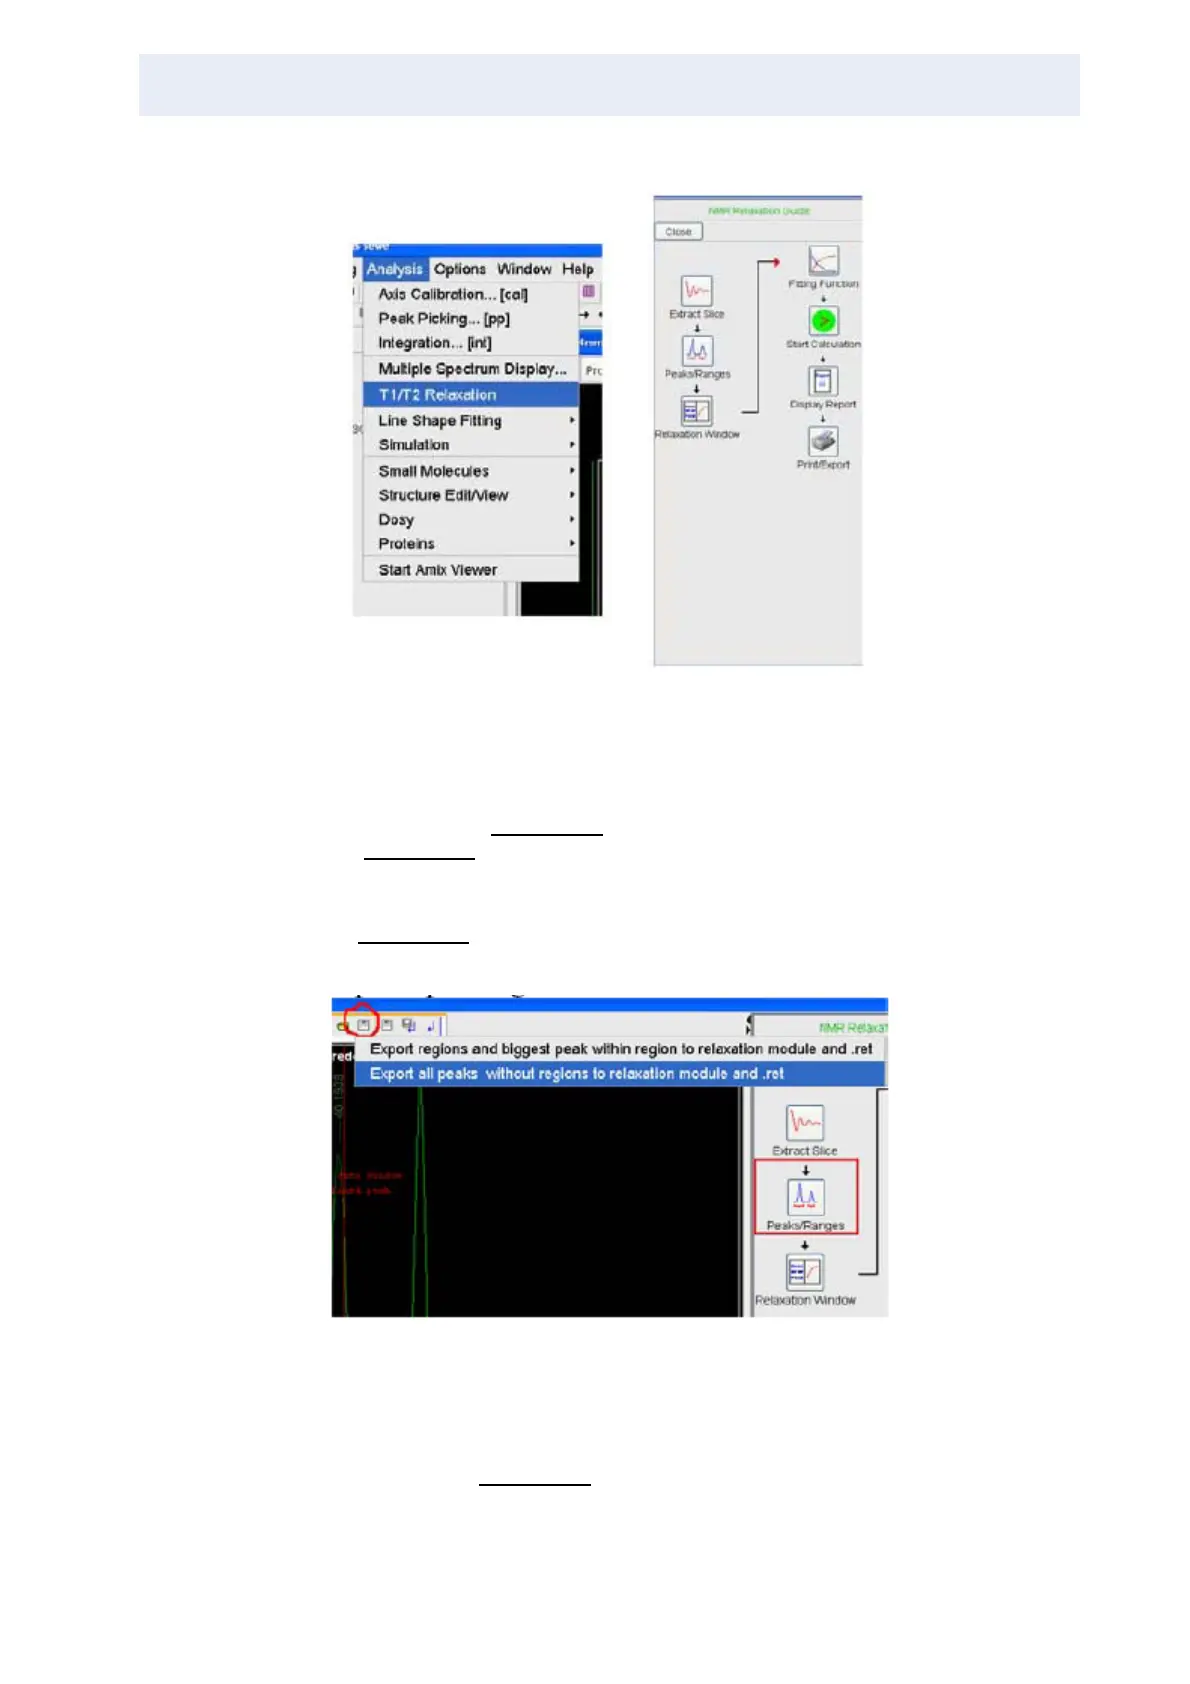
Figure 12.3. T1/T2 Relaxation for further Analysis of the Data Figure and the
Analysis Interface
If you are going to use topspin you have to choose T1/T2-Relaxation in the Analy-
sis Menu (see Figure 12.3.
) to open the graphical interface for the data analysis
(Figure 12.3.
).
To begin extract the first spectrum by using the extract slice button and select the
desired peak by manual peak picking. To save the data use the button shown in
Figure 12.4.
.
Figure 12.4. Saving Data to Continue to the Relaxation Window
Now after switching to the relaxation window, topspin will show the parameter
window which can also be accessed later by clicking the marked button in the up-
per icon bar (Figure 12.5.
). Here the value for number of points has to be set to
the td2 value and the list file name has to be switched to auto, otherwise the data