164 (327) BRUKER BIOSPIN User Manual Version 002
REDOR
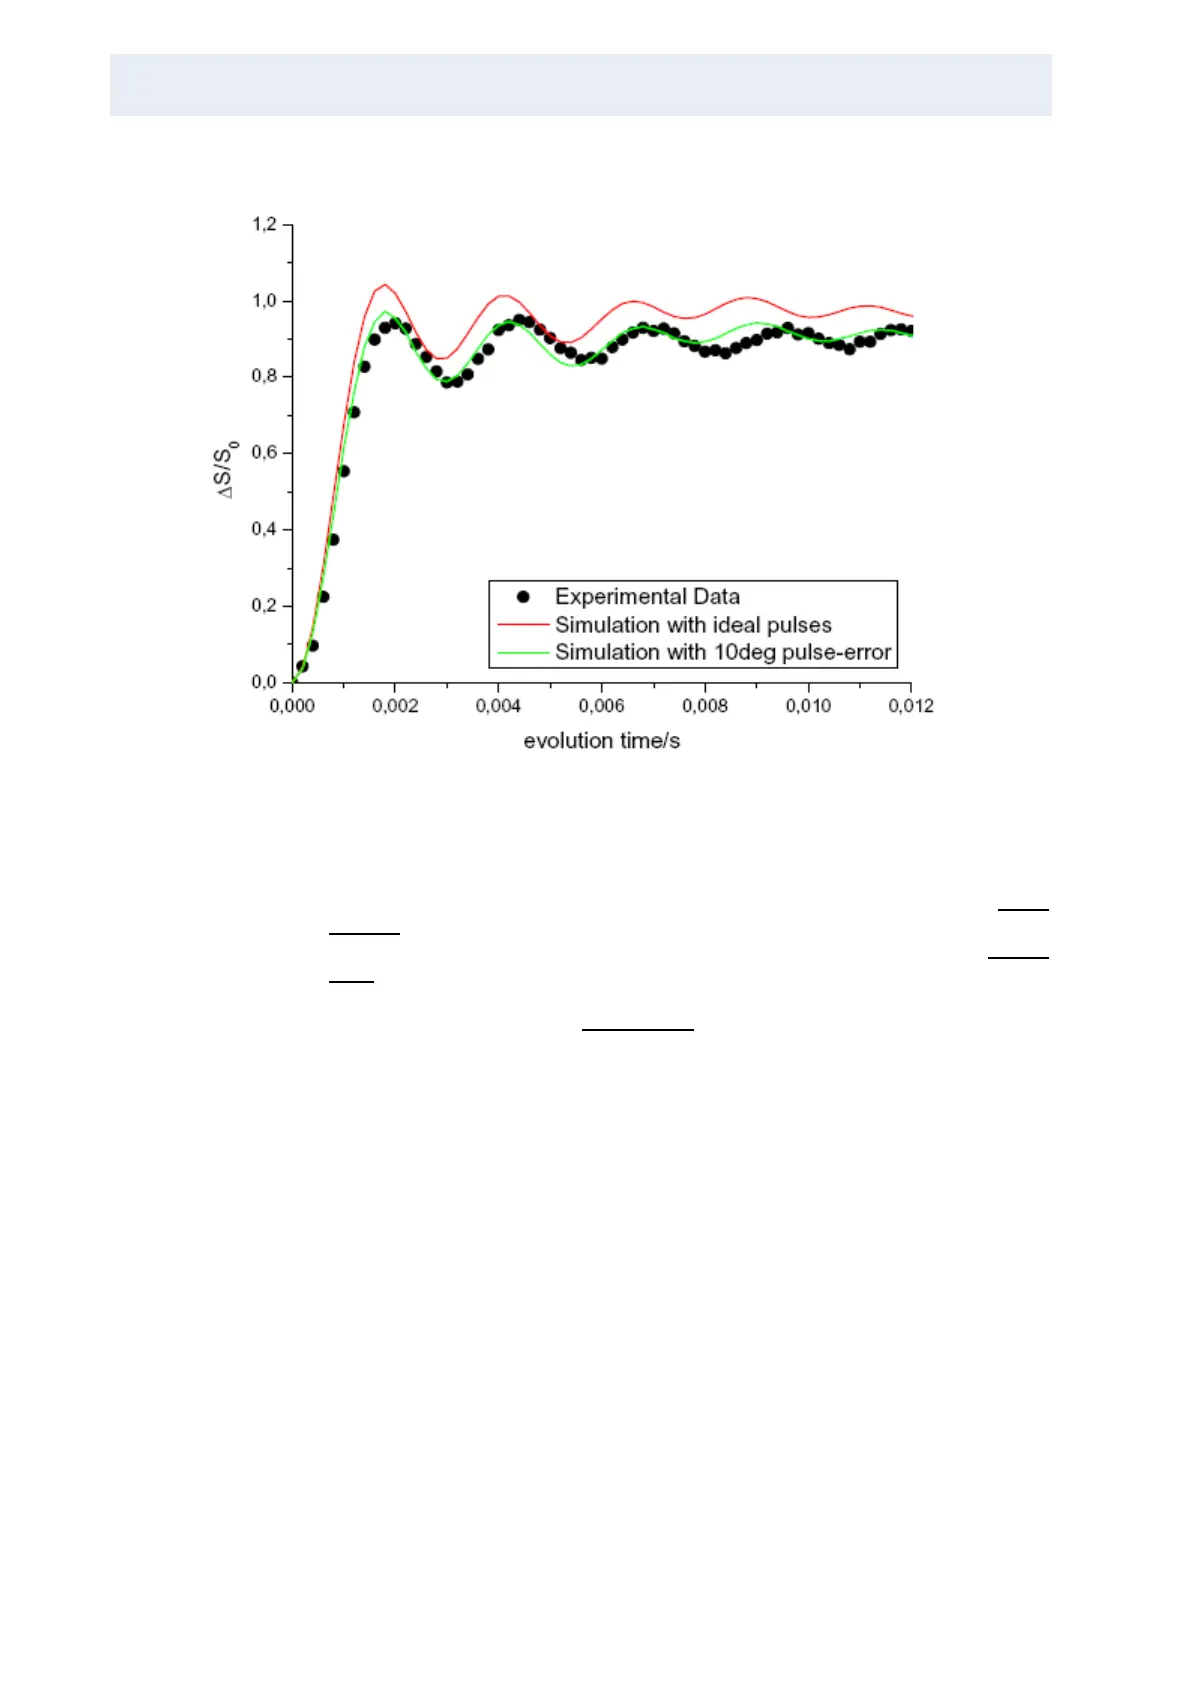
Figure 12.7. Experimental data for the glycine
13
C{
15
N}-REDOR
Red and green curves are the results of different Simpson simulations.
Finally, the complete REDOR curve can be simulated using the S
IMPSON (refer-
ence 8.) NMR simulation package. The following pages will explain the M
2
ap-
proach as well as the S
IMPSON interpretation of the glycine REDOR data. Figure
12.7. shows the experimental data points together with two different SIMPSON sim-
ulations (for details of the geometry and distance information of the labelled
15
N-
13
C
a
spin pair of glycine see reference 9.). The red simulation shows the time de-
pendent evolution assuming ideal p pulse lengths on both the S and I channel
(corresponding to an experiment without any errors on both frequency channels
for
15
N and
13
C), leading to a slightly too high theoretical REDOR curve compared
to the actual experiment. The green curve shows the same simulation assuming
pulse errors of 10% on both channels, corresponding very well with the experi-
mental data.