Setup
User Manual Version 002 BRUKER BIOSPIN 163 (327)
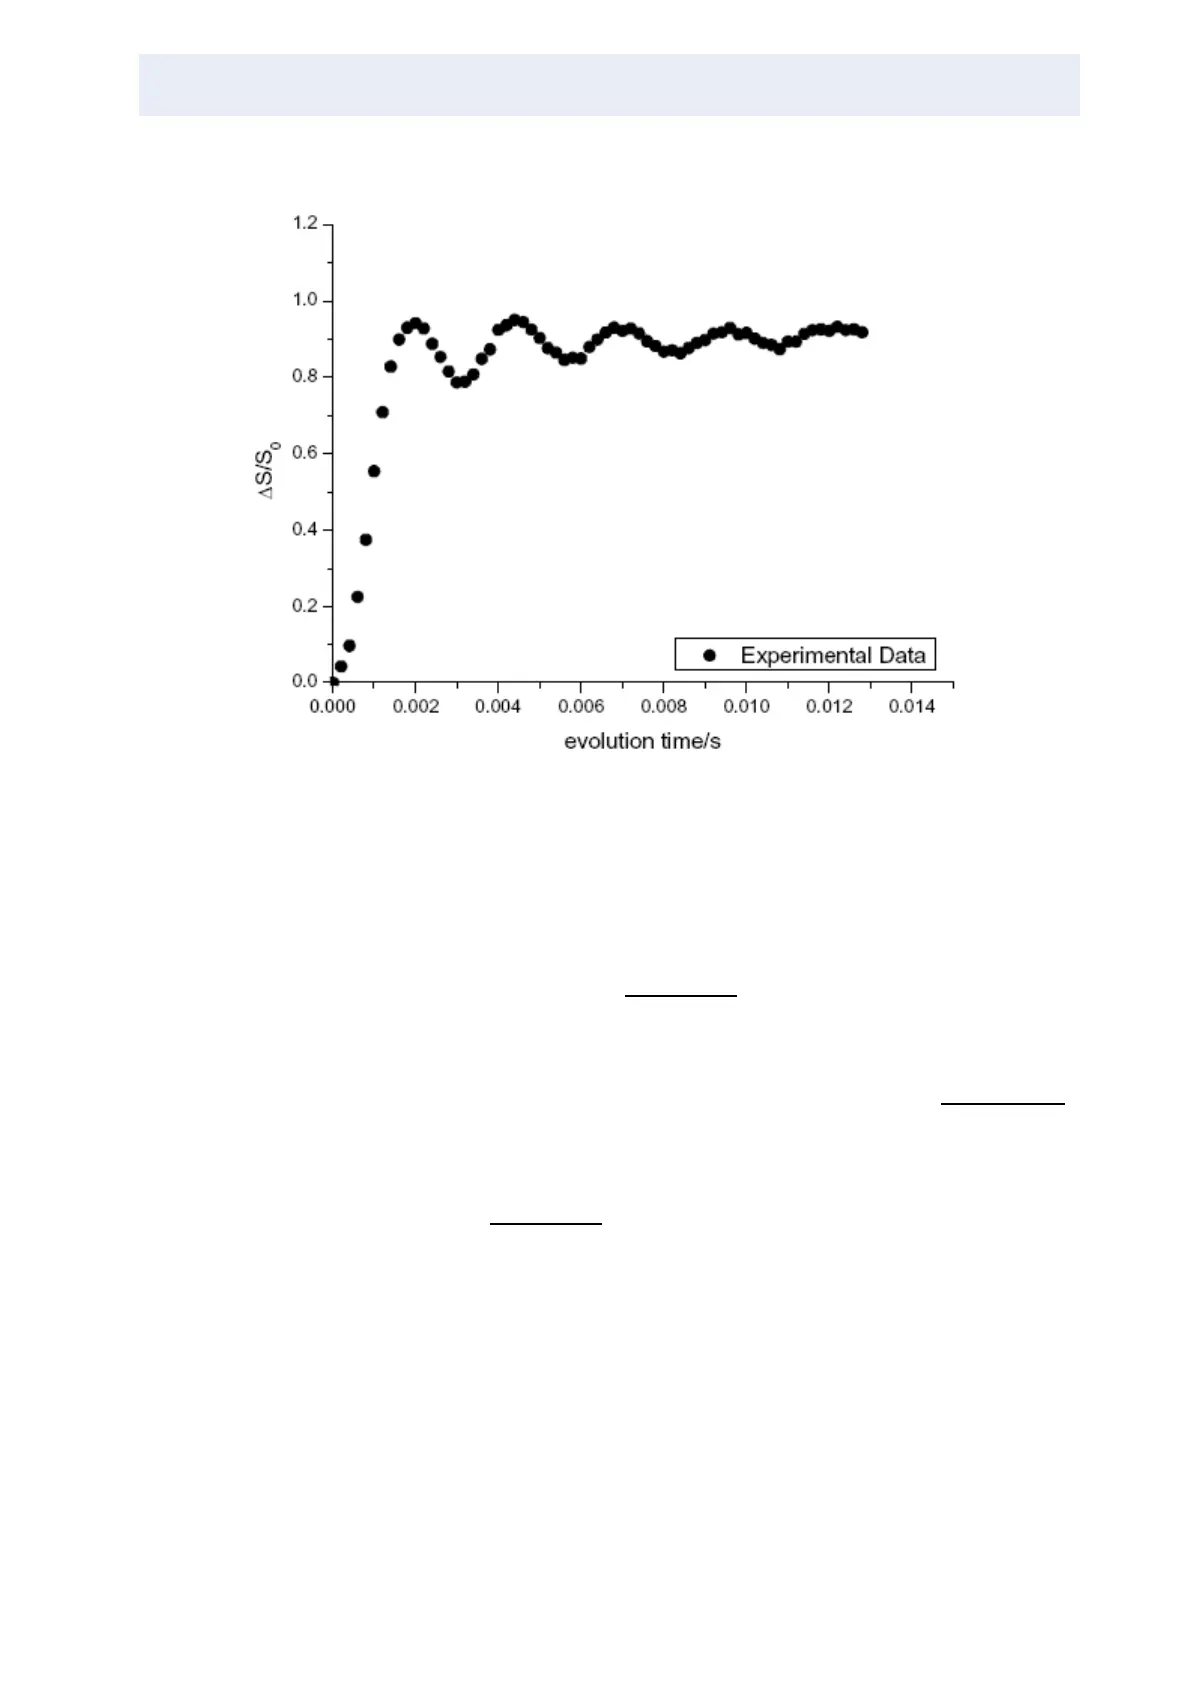
Figure 12.6. Plot of the Normalized Signal Intensity Versus the Evolution Time
There are different methods for the interpretation of the experimentally measured
REDOR curves. In the case of isolated two spin systems, like in this case of
15
N-
13
C
a
-glycine, it is generally possible to fit the experimental dephasing curve by us-
ing a combination of bessel functions. This is called the “REDOR transformation”
and gives you direct access to the dipolar coupling information for the measured
spin system (for details check reference 6.
).
The more common way for the interpretation of the experiment is the second mo-
ment approach, which is also suitable for multiple spin systems. Here the begin-
ning of the REDOR curve can be fitted by a parabolic approximation up to
normalized signal intensities of about 0.2-0.3 (for details see e.g. reference 10.
).
In the case of very strong dipolar couplings this approach may be restricted to
very high MAS spinning speeds, because otherwise it will not be possible to get
enough data points within the 0.3 area of the curve (it here may be useful to use a
more efficient REDOR technique for strong dipolar coupled systems, like CT-RE-
DOR, see e.g. reference 7.
).