128 (327) BRUKER BIOSPIN User Manual Version 002
Modifications of FSLG HETCOR
Carbon Decoupling During Evolution 9.1
The only difference between lghetfq and lghetfqpi is the decoupling π-pulse at
the center of the evolution period. All what needs to be set in addition is the X- π-
pulse p2 at power level pl1. At fast spin rates and in fully labeled samples, the
narrowing effect on the proton spectrum may be small or not noticeable, but on
samples with natural abundance it may be noticeable. At long contact times and
transfer from many different protons, the line width in the proton spectrum may
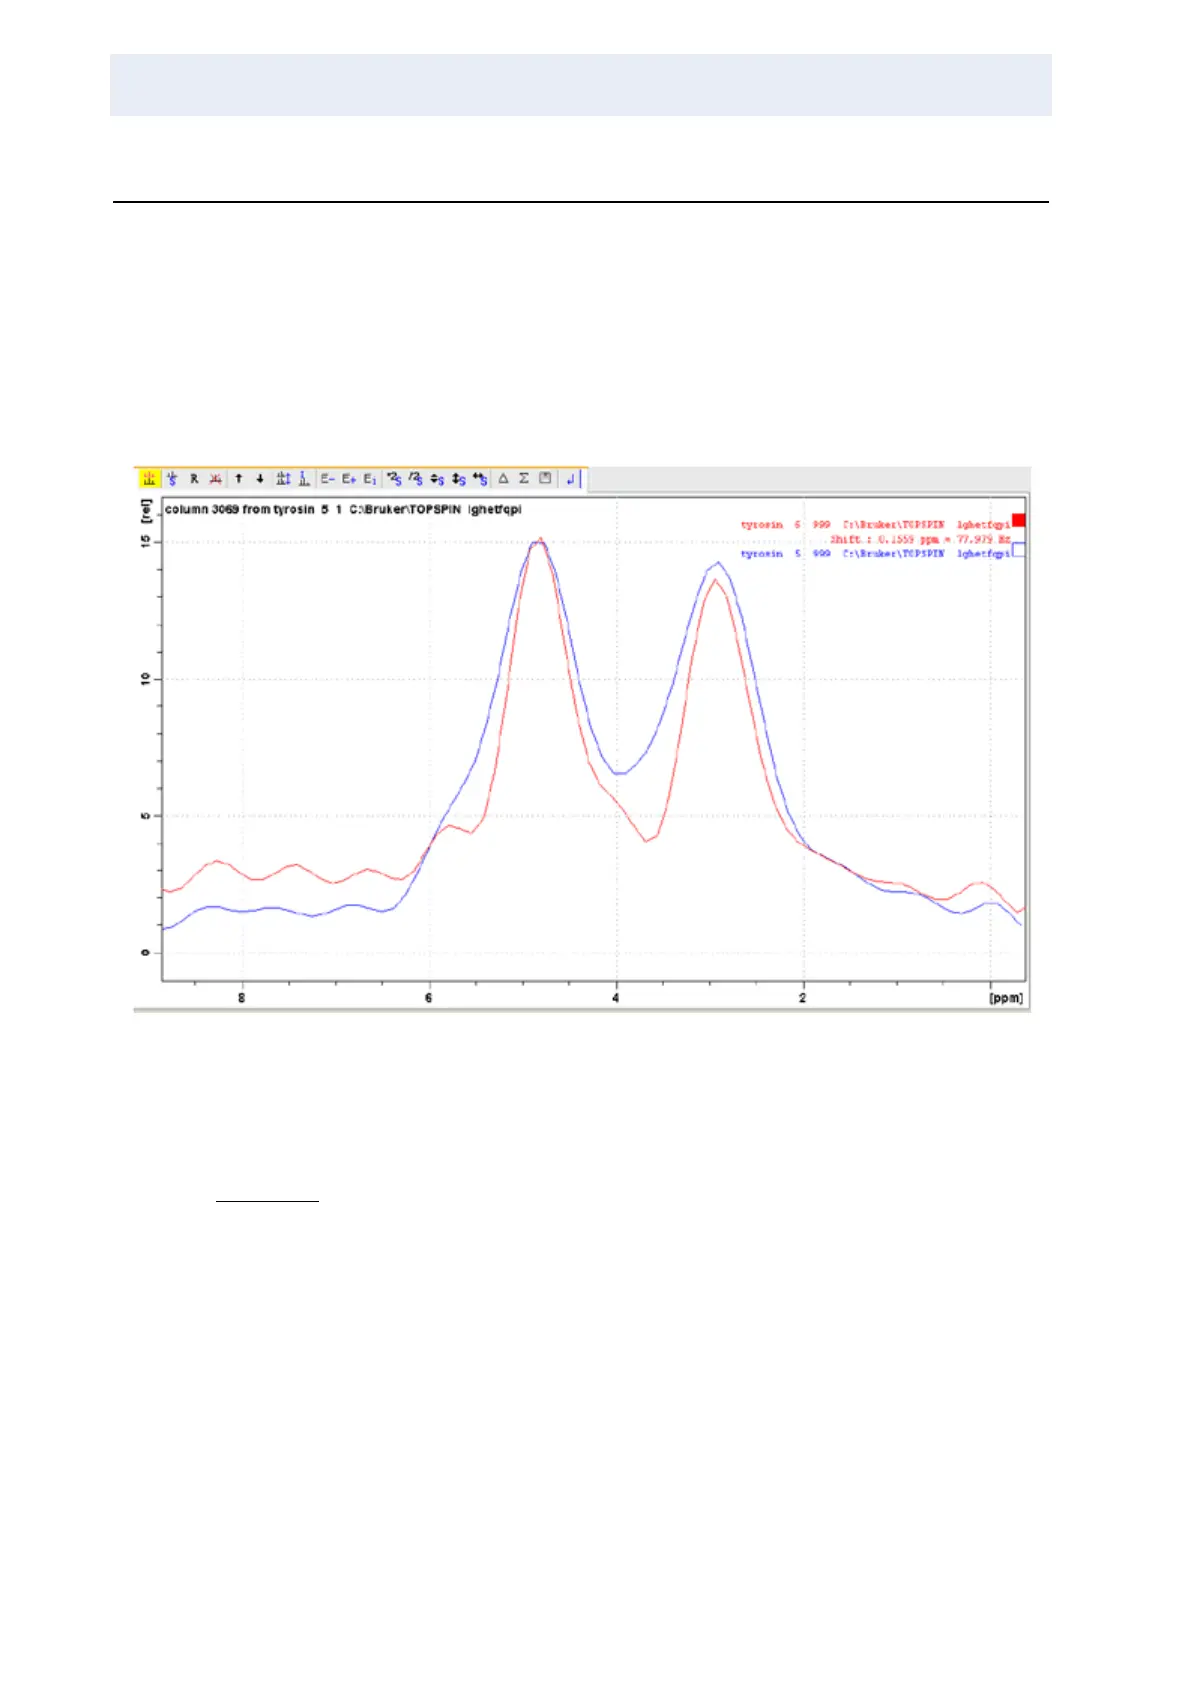
also be insensitive. In fig. 1, two columns through the most up field aliphatic peak
in tyrosine-HCl are shown. The π-decoupled trace (red) is clearly narrower.
Figure 9.1. Comparison of HETCOR with and without
13
C-decoupling
The figure above shows a comparison of HETCOR with and without
13
C-decou-
pling. Natural abundance tyrosine-HCl was run with 50 µsec contact time.
Reference:
1. A. Lesage and L. Emsley, Through-Bond Heteronuclear Single-Quantum Correlation Spectroscopy in
Solid-State NMR, and Comparison to Other Through-Bond and Through-Space Experiments, J.
Magn. Res. 148, 449-454 (2001).
 Loading...