Setup
User Manual Version 002 BRUKER BIOSPIN 165 (327)
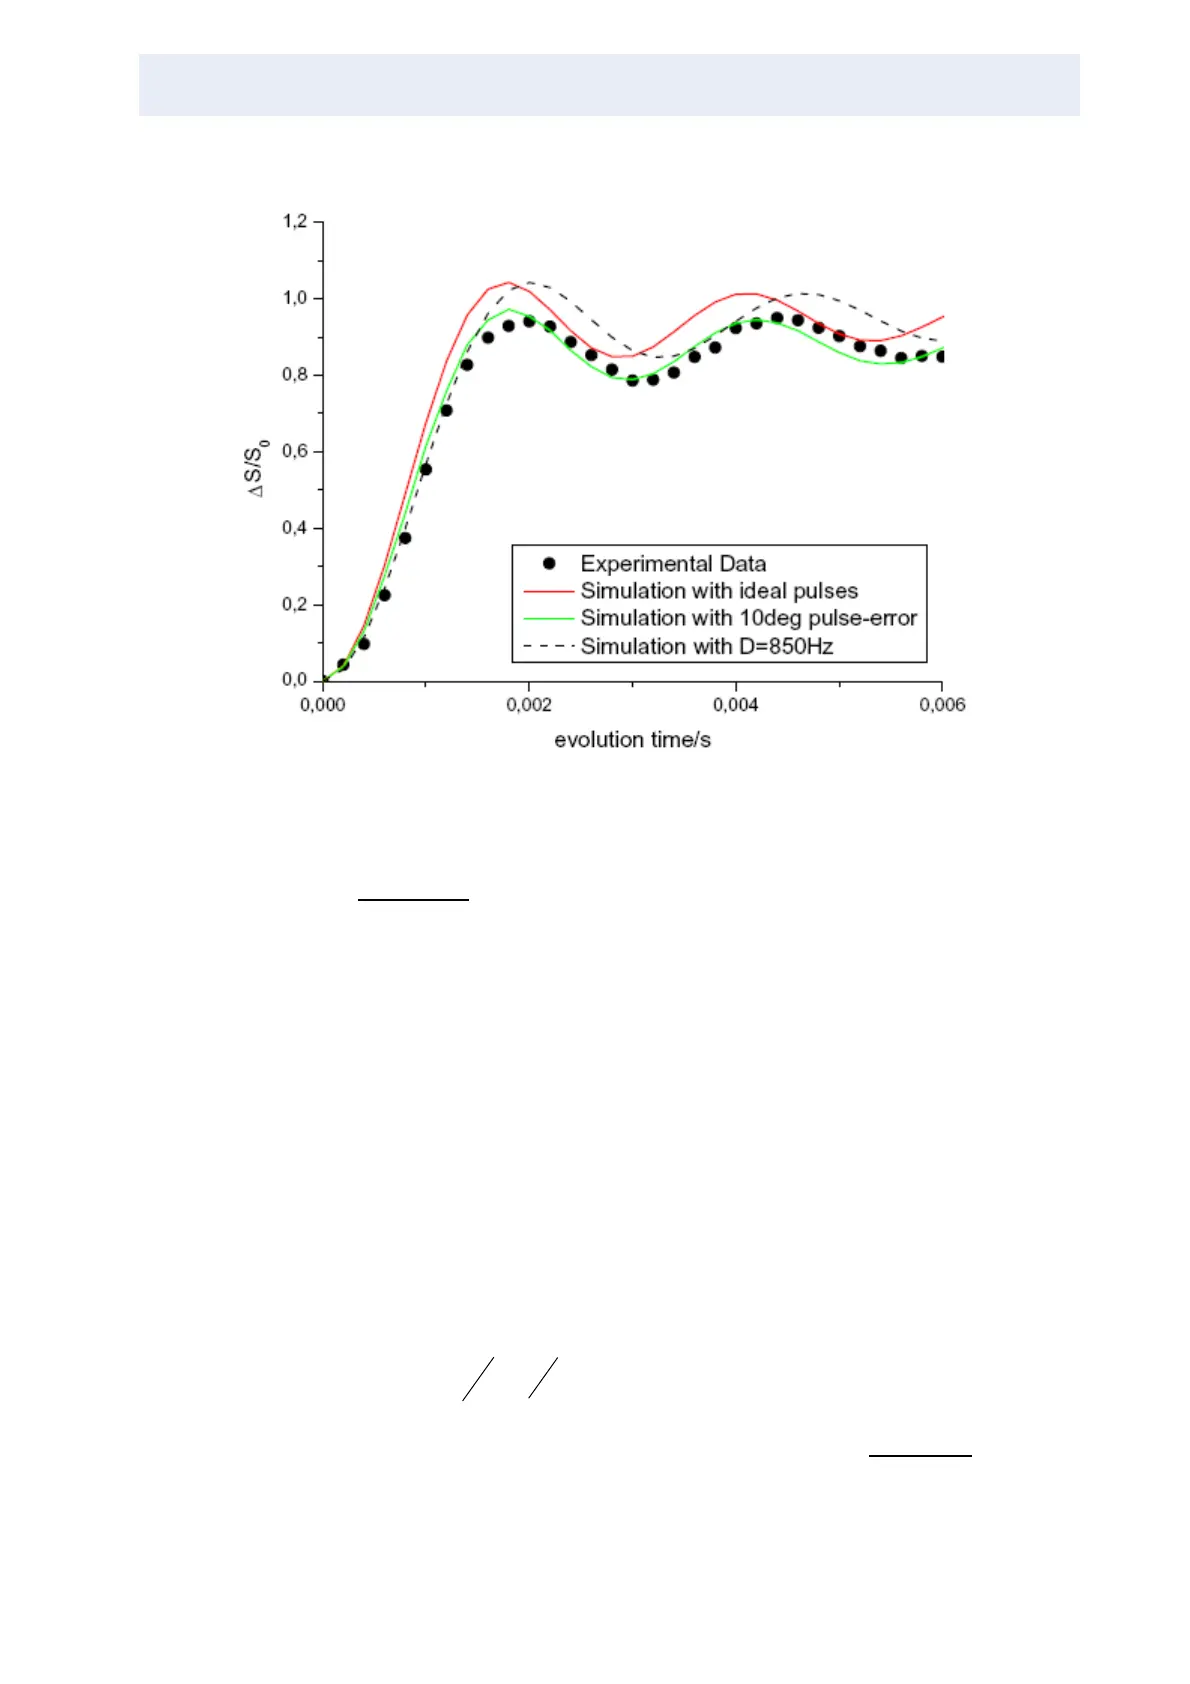
Figure 12.8. Comparison of Experimental Data to a Simulation with Reduced Di-
polar Coupling
Figure 12.8.
shows a zoomed view of the beginning REDOR curve for the glycine
sample. The third, simulated line (broken black line) shows a S
IMPSON simulation
with ideal pulses on both channels, but varying the dipolar coupling between I and
S in order to fit to the experiment. The simulation using a dipolar coupling con-
stant of 850 Hz fits the experimental data points very well. This coupling can be
transformed into a distance between
15
N and
13
C of about 1.53 Å, which is com-
pared to the theoretical value of 1.47 Å (964 Hz) an error within 10%. As you can
see, in an unknown spin system, the interpretation by using S
IMPSON will always
suffer from the fact that a non optimal setup of the experiment will introduce the
same error like a reduced dipolar coupling between the analyzed spins; these two
effects can not be easily separated from each other during the interpretation pro-
cess. Therefore it is useful to perform a calibration run like the glycine measure-
ment before analyzing an unknown sample and to set up the complete experiment
very carefully in order to calibrate the experiments.
The above shown simulated REDOR curves can now be used to demonstrate the
second moment approach in analyzing REDOR experiments. Here a parabolic fit
is used to describe the first few points of each curve. In the case of the isolated
two spin system of the glycine this parabola is defined by:
(Eq. 12.3)
Using this equation you end up with the values given in Table 12.2.
for the dis-
tances and the second moments. The M
2
values given in brackets for the simulat-