Basic CP-MAS Experiments
User Manual Version 002 BRUKER BIOSPIN 117 (327)
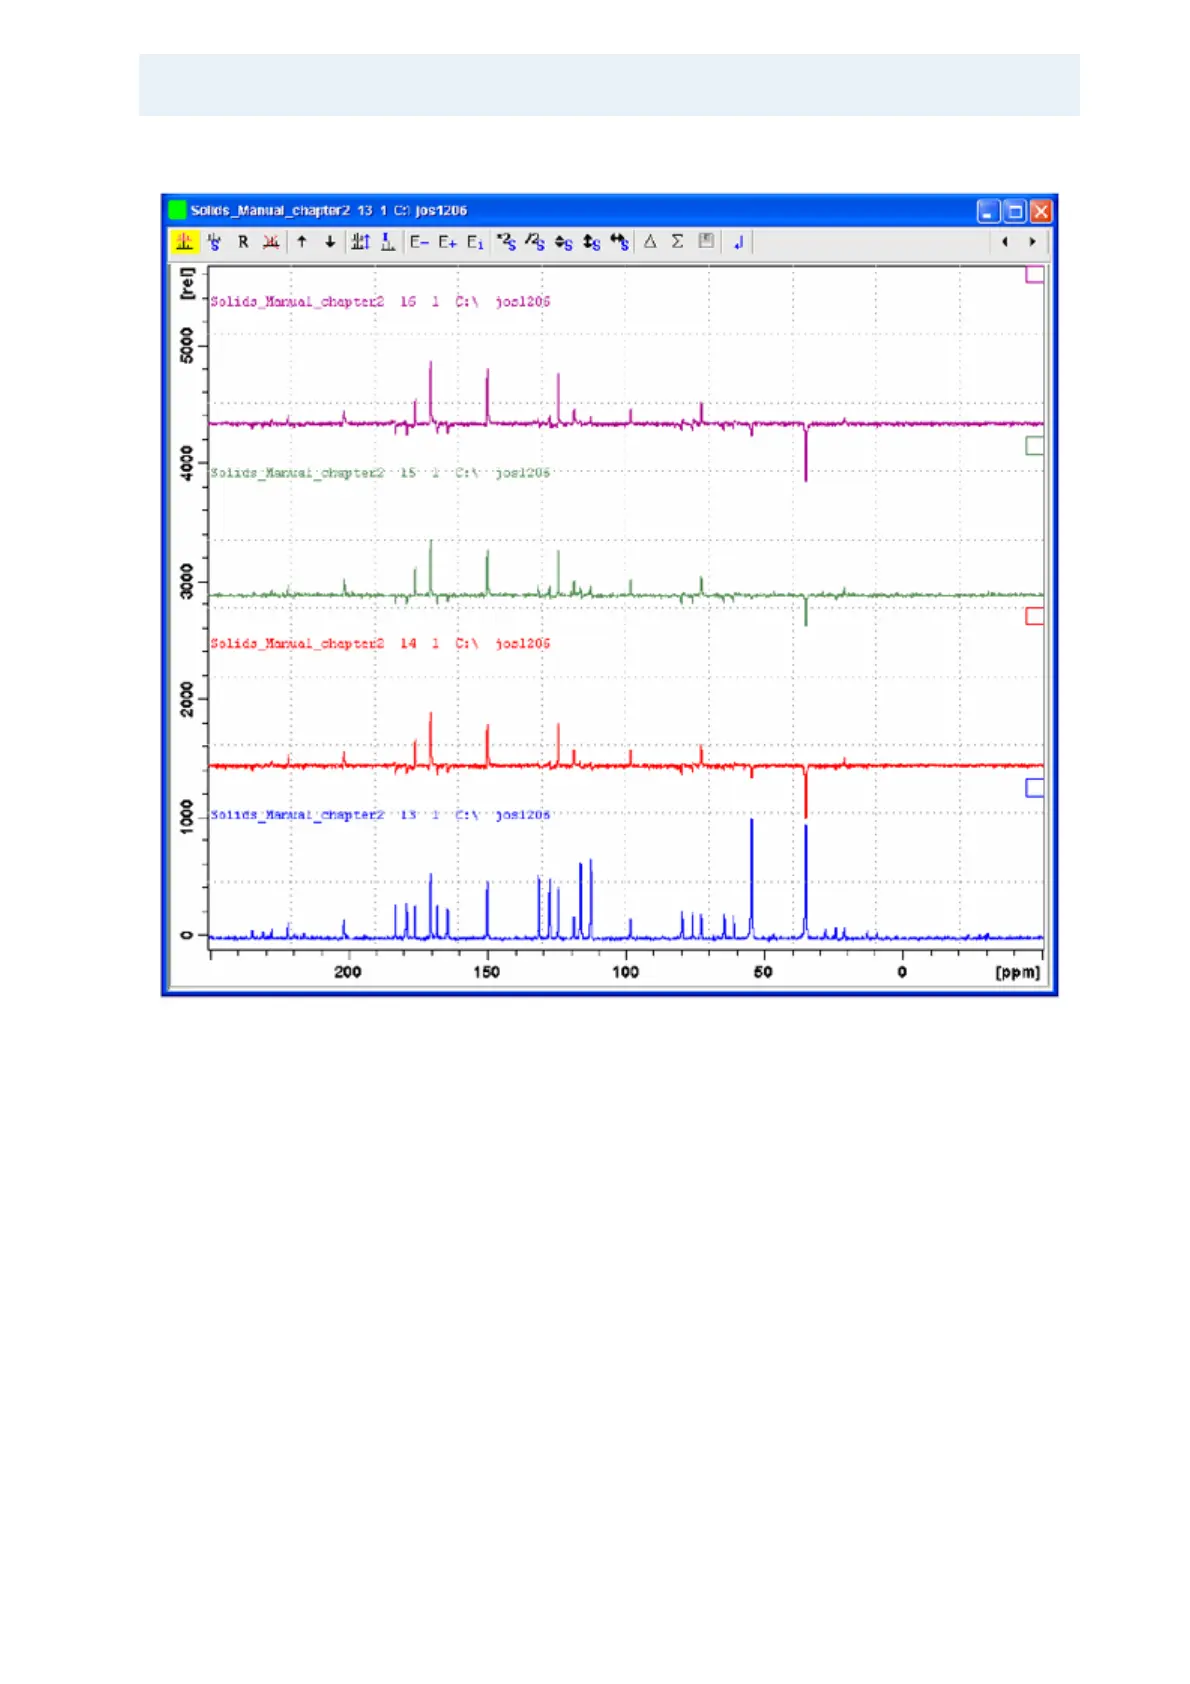
Figure 7.13. CPMAS Spectrum of Tyrosine.HCl at 6.5 kHz
CPMAS spectrum of tyrosine.HCl at 6.5 kHz sample rotation obtained on a 500
WB spectrometer using a 4 mm CPMAS double resonance probe. The red (third)
spectrum is a CPPI spectrum where we see the CH
2
resonance at 35 ppm with a
negative intensity. The aromatic CH resonances are clearly suppressed, where
the C
a
shows a slightly negative intensity. The polarization inversion pulse p16
was 40 µs long. The green (second) spectrum is a CPPIRCP experiment with
p16=40 µs and p17=10 µs for better nulling of CH resonances, but in this case the
aromatic CH resonances gained some intensity back. The purple (first) spectrum
is a CPPISPI experiment with a similar performance as for the CPPI spectrum.
Our experience is that one can adjust p15 (= 1 ms in this spectrum), p16 (= 30 µs
in the purple spectrum) and so edit for pure CH resonances for example. Such
tuning needs to be done of course on a known sample, which behaves similarly to
the one under investigation, for the editing to be conclusive and correct.
Note: For more editing experiments consider the Solid State Attached Proton
Test experiment, using the sostapt pulse program name, or look at 2D editing se
-
quences, based on the FSLG HETCOR experiment.