Relaxation Measurements
User Manual Version 002 BRUKER BIOSPIN 203 (327)
where t is the relaxation delay, S
E
is the maximum signal seen when t is infinite,
S(0) is the signal measure with no relaxation delay, and T
1
is the relaxation time
constant for the spins giving rise to that signal. Measurement of S(t) for a number
of relaxation delays allows determination of T
1
.
The disadvantage of the inversion recovery experiment is that the delay between
scans needs to be somewhat longer than the longest T
1
of the slowest relaxing
spins in the sample. If cross-polarization from protons is possible, the initial inver
-
sion pulse can be replaced by a cross-polarization step followed by a 90° pulse on
the nucleus to be observed. Then, the required delay between scans d1 becomes
that for relaxation of the protons. In most cases, the proton T1 is moderate so in
-
version recovery (Torchia method) is the method of choice.
If the T1 relaxation time is extremely long, the saturation-recovery experiment is
preferred. Here, the transitions are saturated by a rapid sequence of hard pulses,
such that no signal remains. There is then a variable delay, during which relax
-
ation occurs, and then a 90° read-out pulse. If the relaxation delay is very short,
no signal is seen, and at long relaxation times the maximum signal is seen. The
advantage is that the saturation time required does not need to be many times the
longest T
1
value. The state of the system at the start of the experiment is forced
by the saturation pulses, so a long recycle delay is not required.
The CP Inversion Recovery Experiment 16.2.2
Sample: Glycine
Spinning speed: 10 kHz
Experiment time: 20 minutes
Before starting the experiment, the spectrometer should be set up as described in
the basic setup procedures chapter, including measurement of the carbon pulse
lengths, and the CP spectrum of glycine should be acquired for reference. Since
relaxation times are necessarily temperature dependent, control of the sample
temperature is desirable. The data shown here were all acquired at an approxi
-
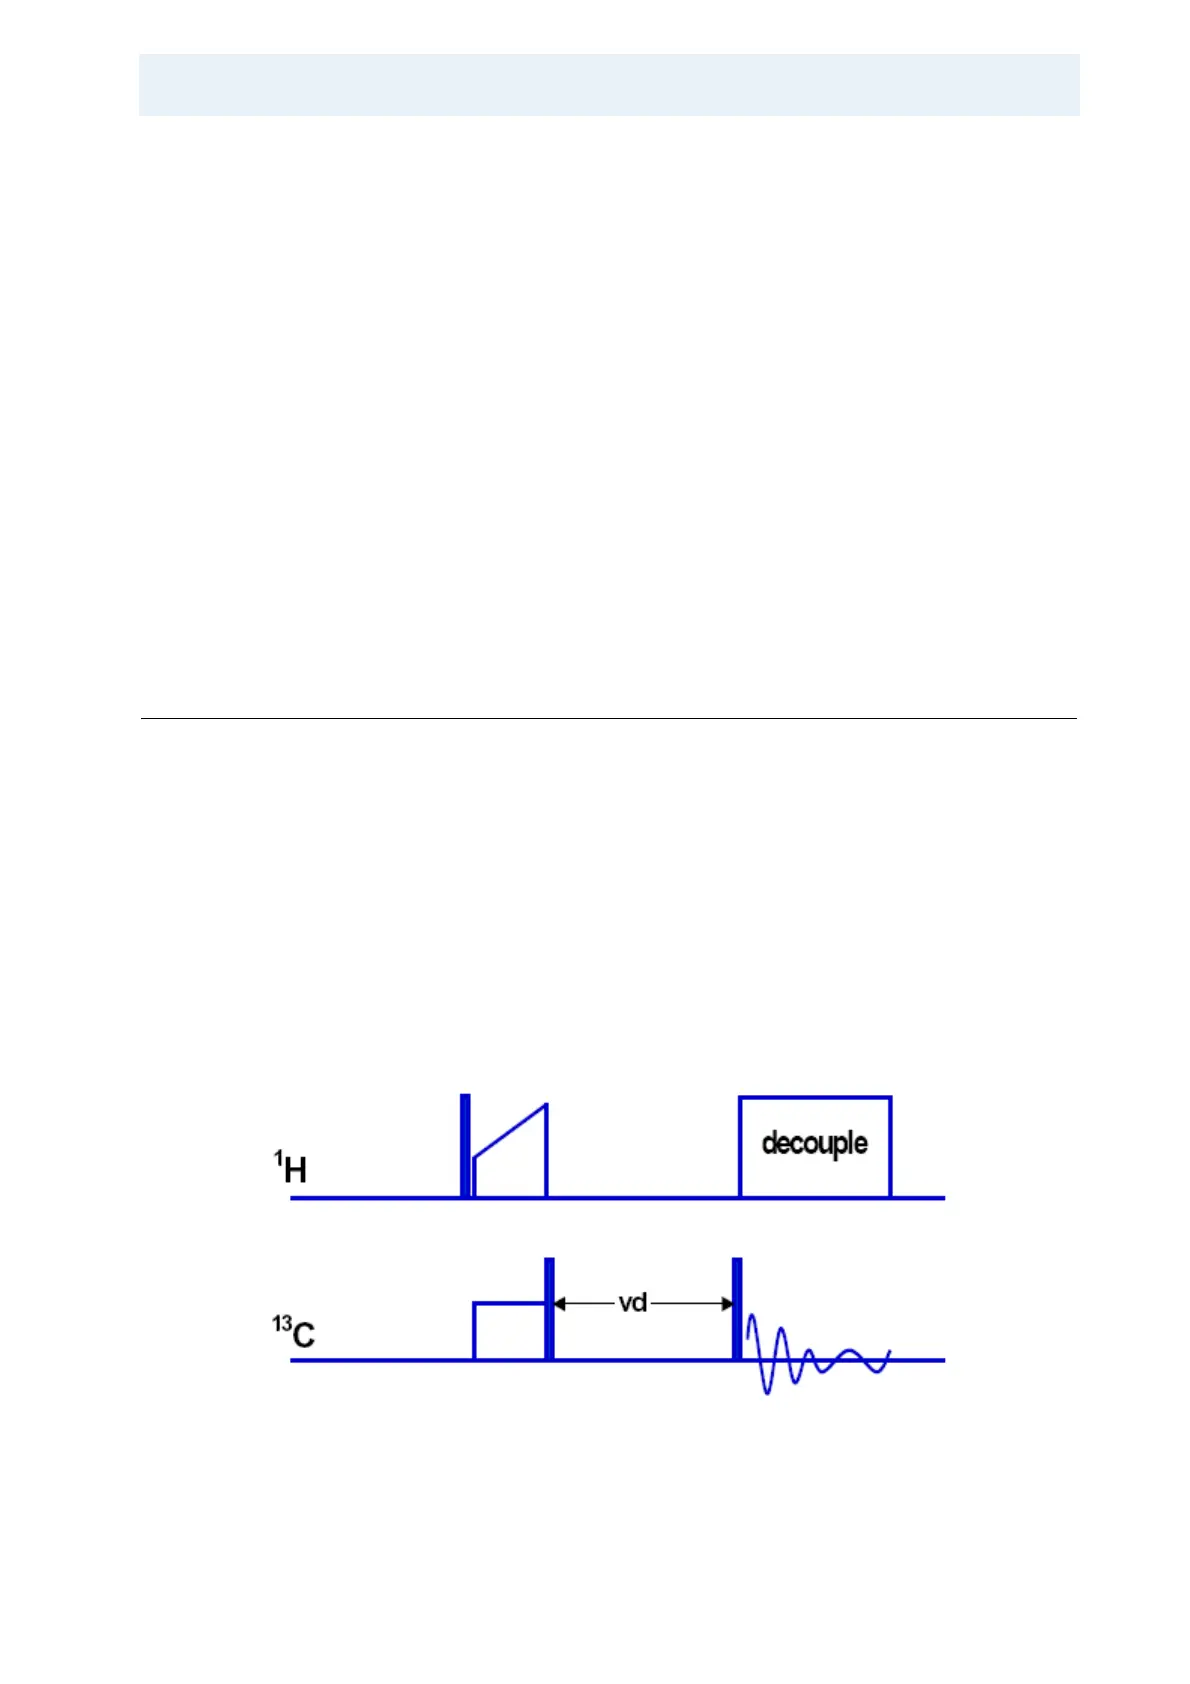
mate temperature of 20° C. The form of the pulse program is shown in the follow-
ing figure.
Figure 16.1. The CPX T1 Pulse Sequence