Relaxation Measurements
User Manual Version 002 BRUKER BIOSPIN 209 (327)
Data Processing
The saturation-recovery data should be processed in the same way as the inver-
sion-recovery data above (see Table 16.3. for parameters). The only differences
are that the fitting function should be satrec rather than expdec, and the slice se-
lected for processing should be the last one (signal is maximum at long recovery
times). The calculated relaxation time constants should be the same as those ob
-
tained by inversion-recovery.
T1p Relaxation Measurements 16.2.5
Rotating-frame relaxation measurements, under a spin-locking rf field, can be
used to probe motions on shorter domestically than T
1
measurements, with in-
verse correlation times of the order of the spin-locking rf field strength.
To measure T
1r
relaxation, after CP a variable length spin-locking pulse is applied
to the X nucleus. The remaining X magnetization decays exponentially to zero, as
a function of spin-lock time. The parameters of cross-polarization can also be de
-
termined from variable-contact-time CP experiments (the function cpt1rho is pro-
vided in the relaxation analysis tool for this purpose), but here only simple T
1r
measurements will be discussed.
It should be noted that the relaxation in a T
1r
experiment might result from pro-
cesses other than true T
1r
relaxation. For example, in glycine, the carbon spins
are dipolar coupled to protons, and there is a possible fast relaxation pathway via
the protons, which is not T
1r
relaxation. This is inhibited by having a high spin-lock
field strength, but at large field strengths care must be taken over the length of the
spin-lock pulse. If apparently non exponential decay is observed, this may result
from such alternative relaxation processes.
Experiment setup
Sample: Glycine
Spinning speed: 10 kHz
Time: 20 minutes
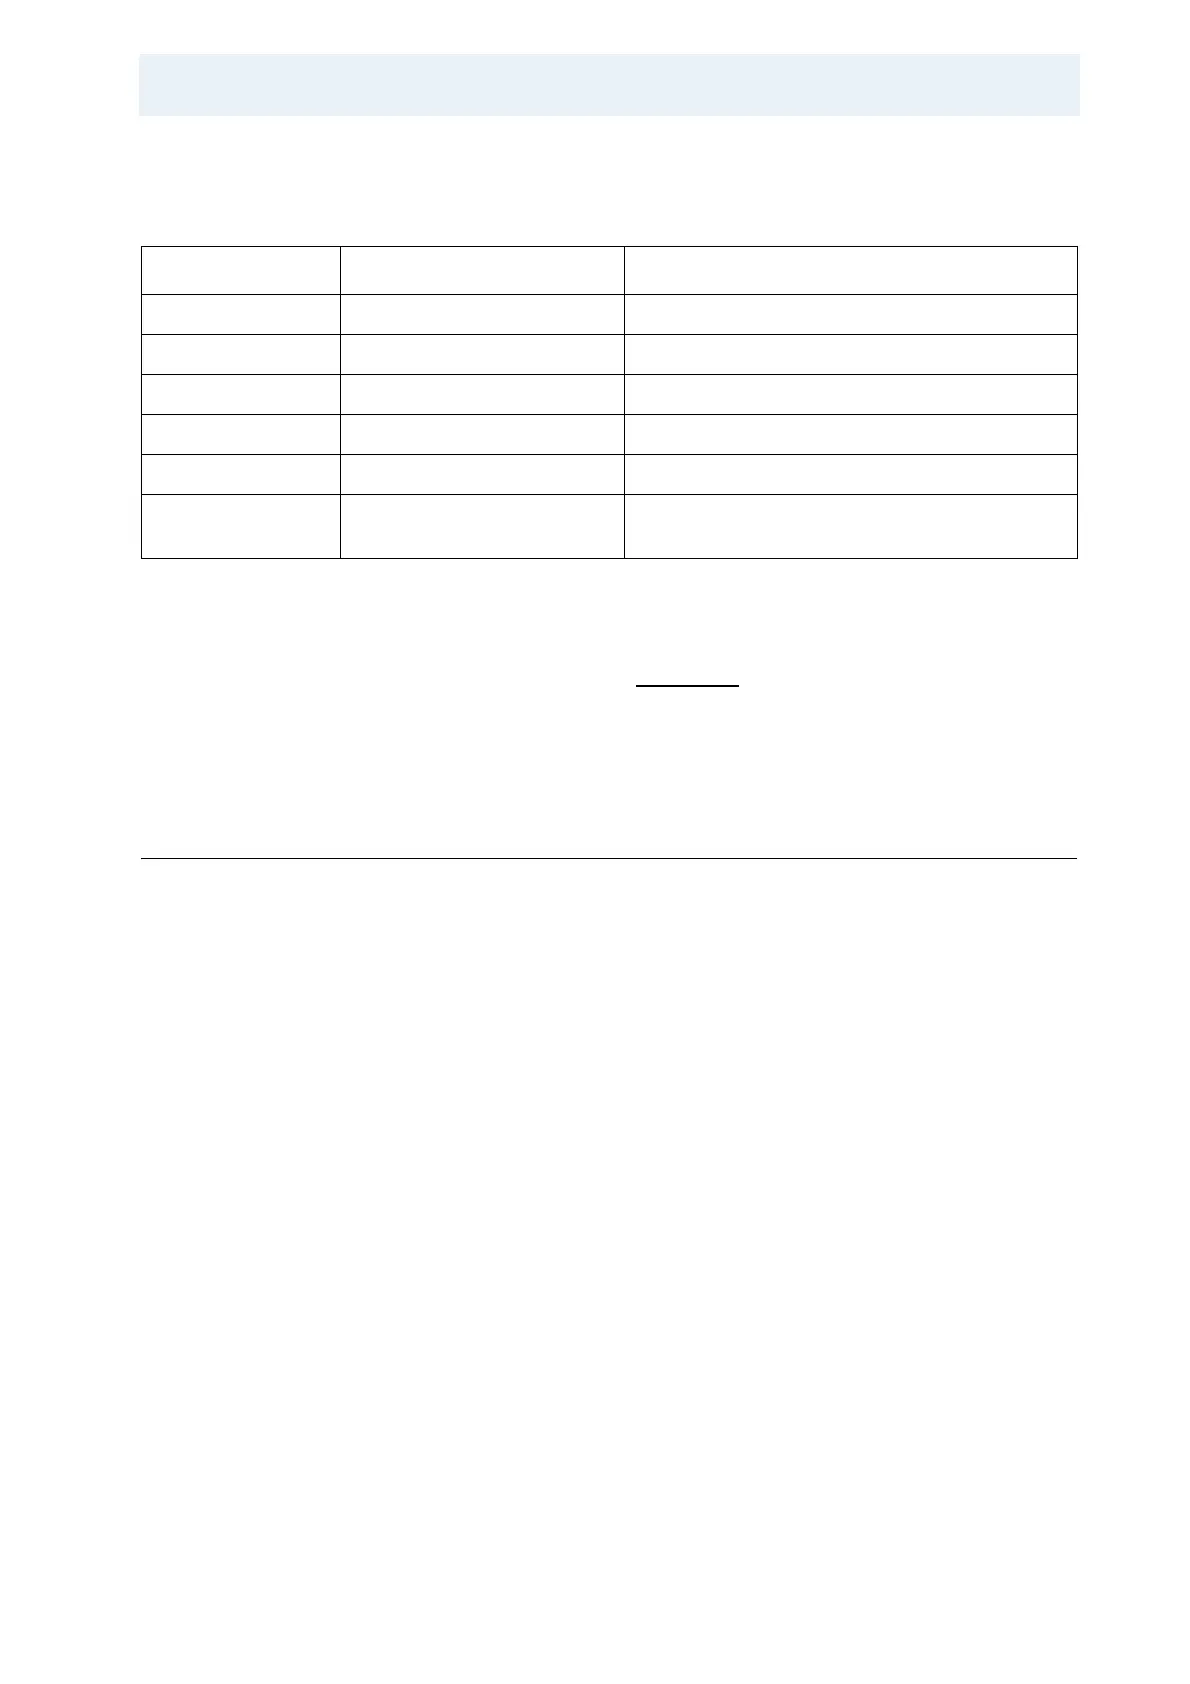
Table 16.4. Parameters for the Saturation Recovery Experiment
Parameter Value Comments
Parmode 2D
Vdlist See text
td(f1) Number of entries in vd list
FnMODE QF This is not a real 2D experiment.
NS 16, for the glycine sample More scans needed than for the CP experiment,
due to reduced signal.