230 (327) BRUKER BIOSPIN User Manual Version 002
Basic MQ-MAS
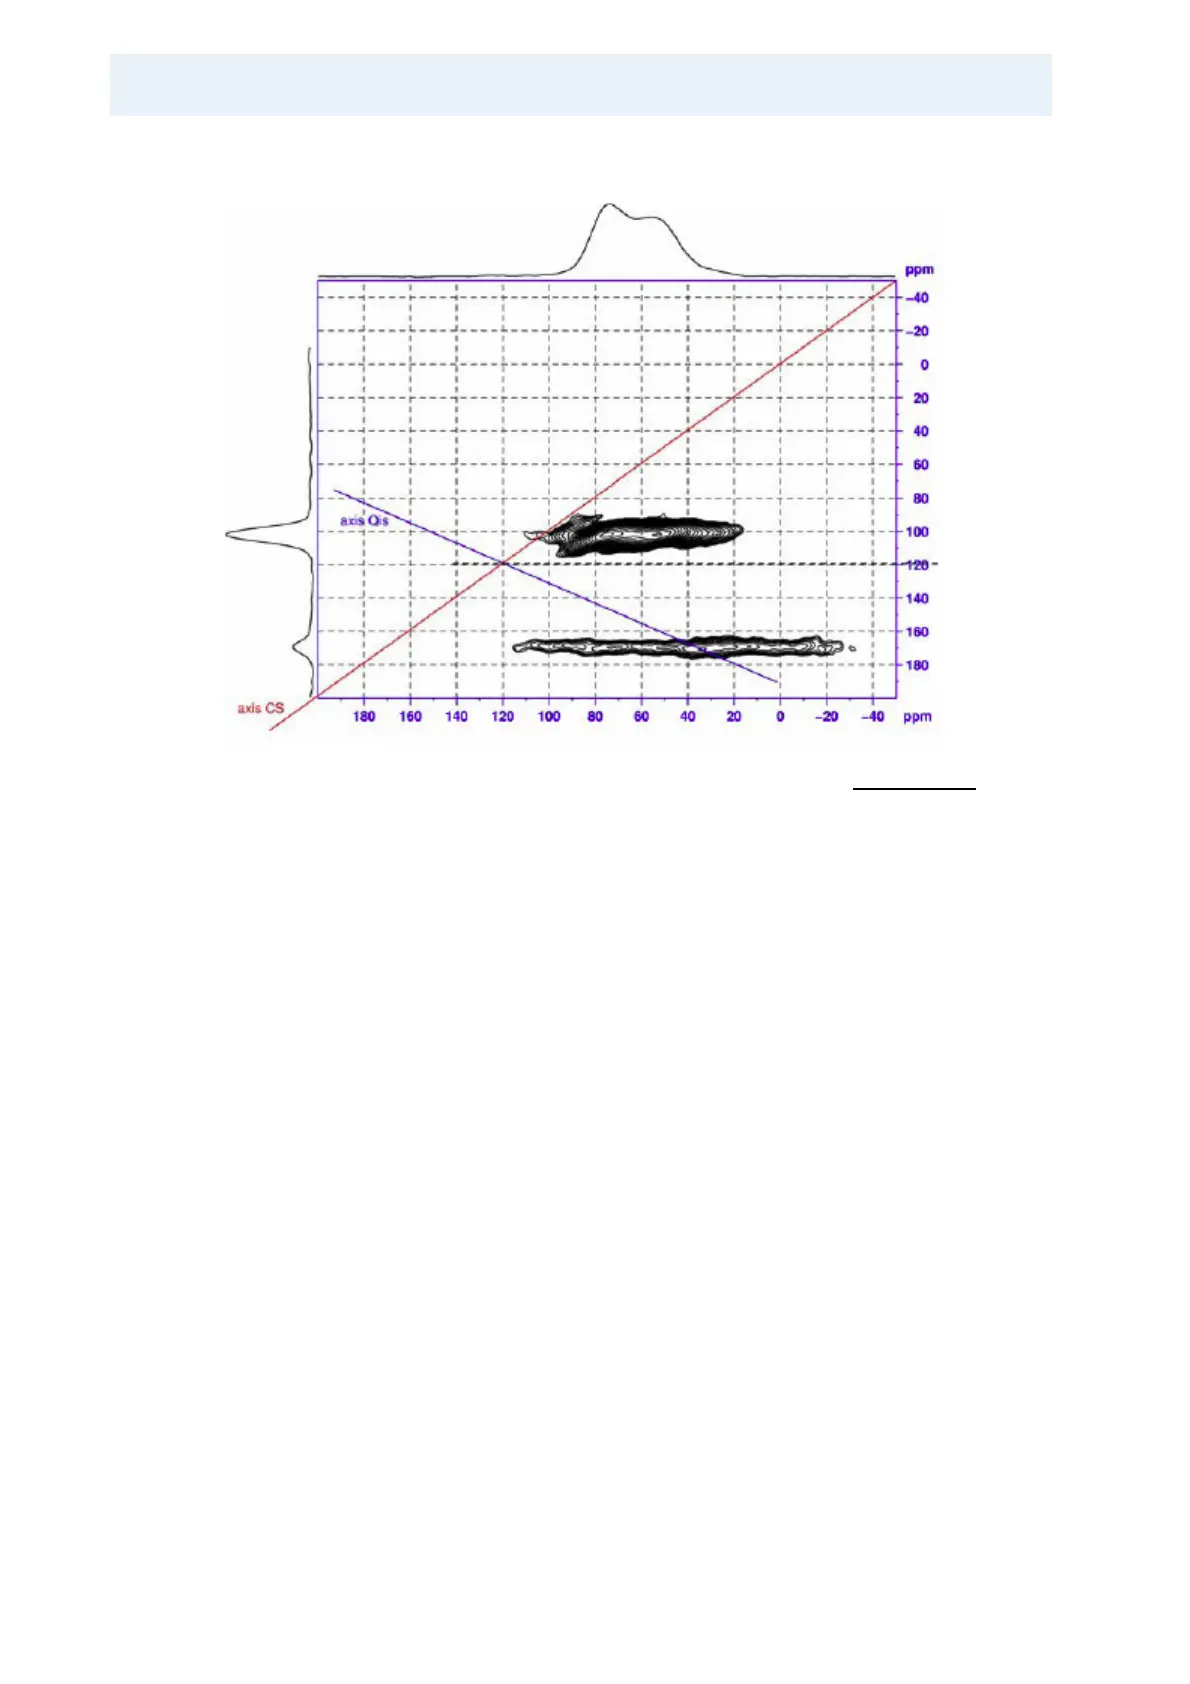
Figure 17.12.Graphical Interpretation of the Spectrum from Figure 17.10..
In the 11.7 T spectrum this gives quadrupole induced shifts
qis
of ≈ -75 ppm and
≈ -20 ppm for the two sites, respectively. At 18.8 T the
qis
of the lower peak in the
2D spectrum decreases to ≈ -30 ppm, whereas it cannot be determined graphical-
ly anymore for the upper peak since the chemical distribution broadens the peak
in the F1 dimension more than the theoretical
qis
of ≈ -5 ppm.