294 (327) BRUKER BIOSPIN User Manual Version 002
CRAMPS 2D
Examples 24.4
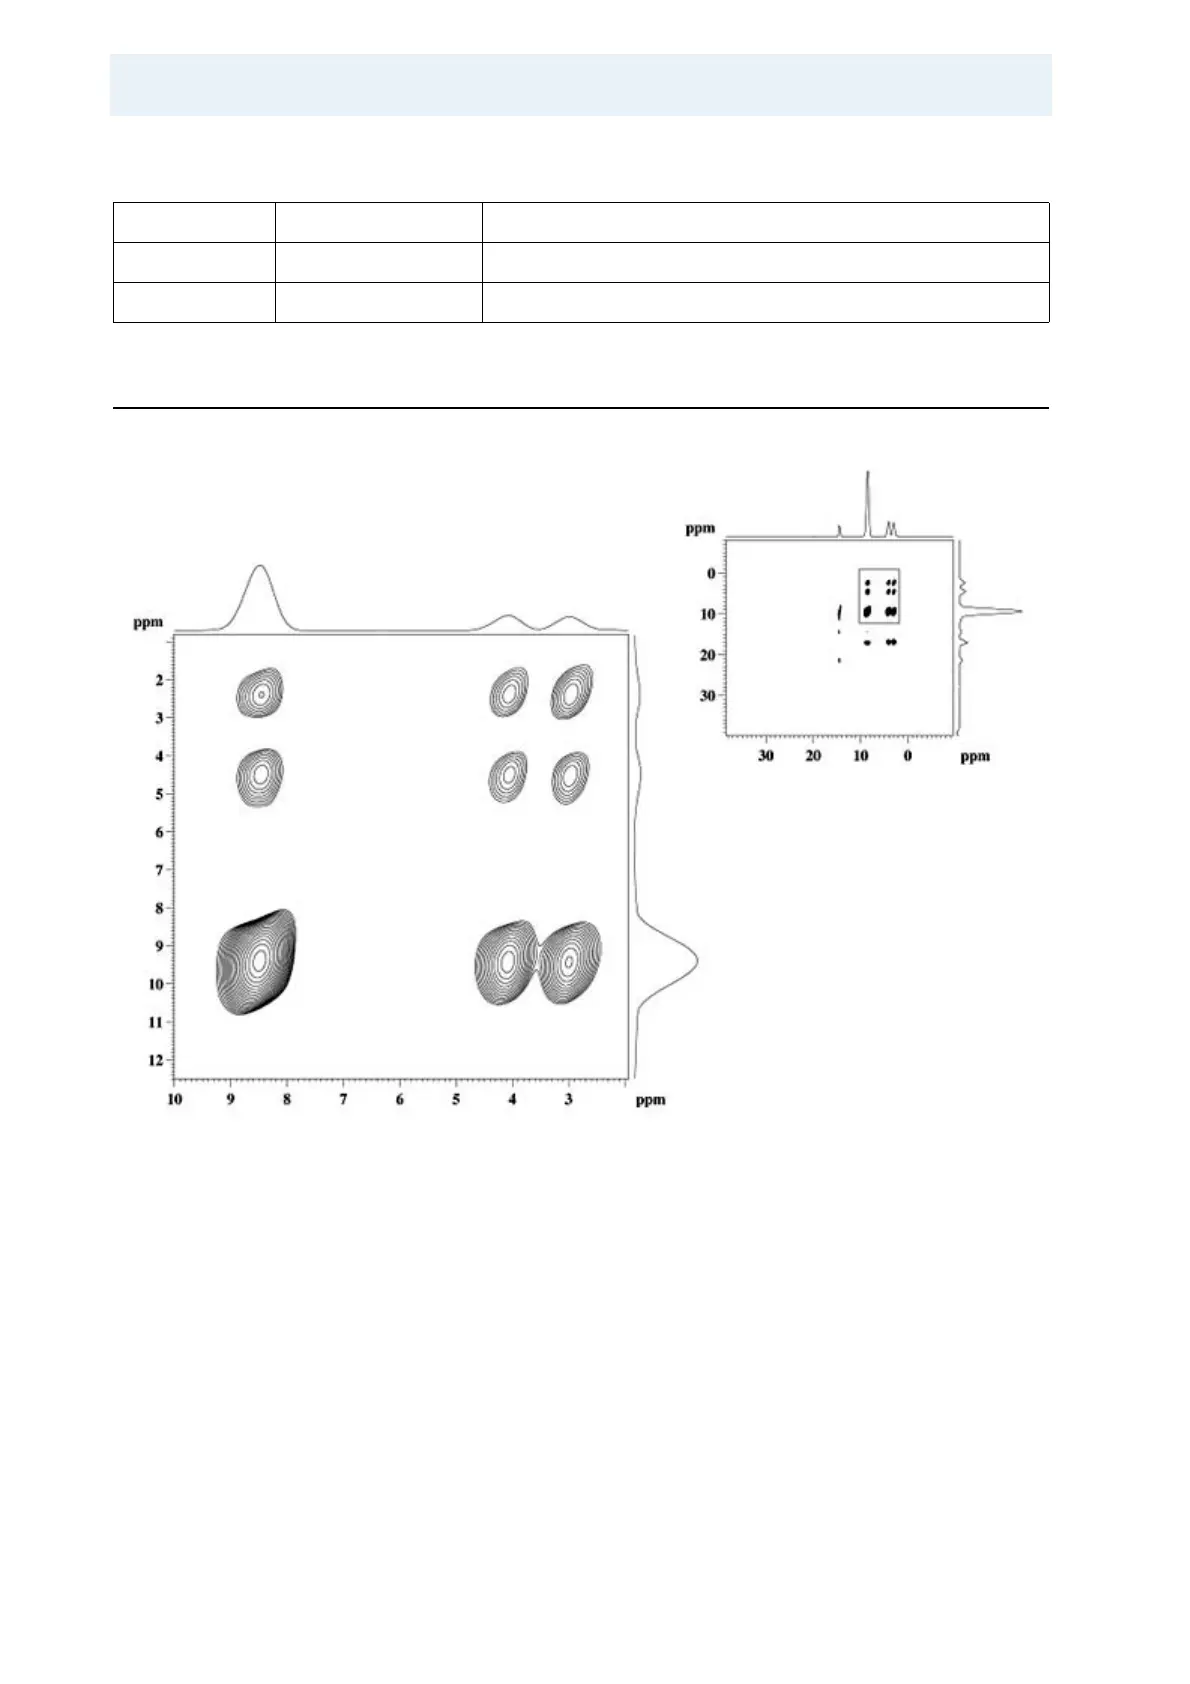
Figure 24.2. Setup and Test Spectrum of Alpha-glycine
The figure above shoes the setup and test spectrum of alpha-glycine (N.B. glycine
samples containing gamma glycine will show additional peaks!). The protons at
-
tached to the alpha-carbon are in-equivalent and strongly coupled. The cross
peaks at 3 and 4 ppm will show at a mixing time as short as 50 µsec, the cross
peaks to the NH
3
-protons at 9 ppm require 200 -300 µsec to show. The mixing
time here was 500 µsec. A sequence without carrier spike suppression was used
here.
ssb 3 or 5
si 2k -4k
1 si 512 – 1k
Table 24.3. Processing Parameters
Glycine, proton-proton shift
correlation using pmlg for
homonuclear decoupling in
both dimensions. All
correlations show with 500
µsec mixing time.
Small plot: full spectrum, large
plot: ROI only.