160 (327) BRUKER BIOSPIN User Manual Version 002
REDOR
Data Processing 12.2.2
The following refers to the sequence cpredori, where the REDOR-experiment
and the reference experiment are executed in an interlaced mode (which is less
likely to be subject to systematic errors).
The acquired NMR data are arranged in a 2D like structure, every odd row (1, 3,
5,…) contains the REDOR data set with additional p pulses on channel I (S’ ex-
periment), every even row (2, 4, 6,…) contains the corresponding echo experi-
ment (S
0
experiment) with the same evolution period t, after the RAW-Data is
processed with the “XF2” command (see Figure 12.2.
). For further processing
you can then either use the function “T1/T2 Relaxation” in the analysis part of Top-
spin in order to do the integration and/or find the peak maxima of the S
0
and S’ in-
tensities automatically or use your favorite deconvolution program for data
analysis.
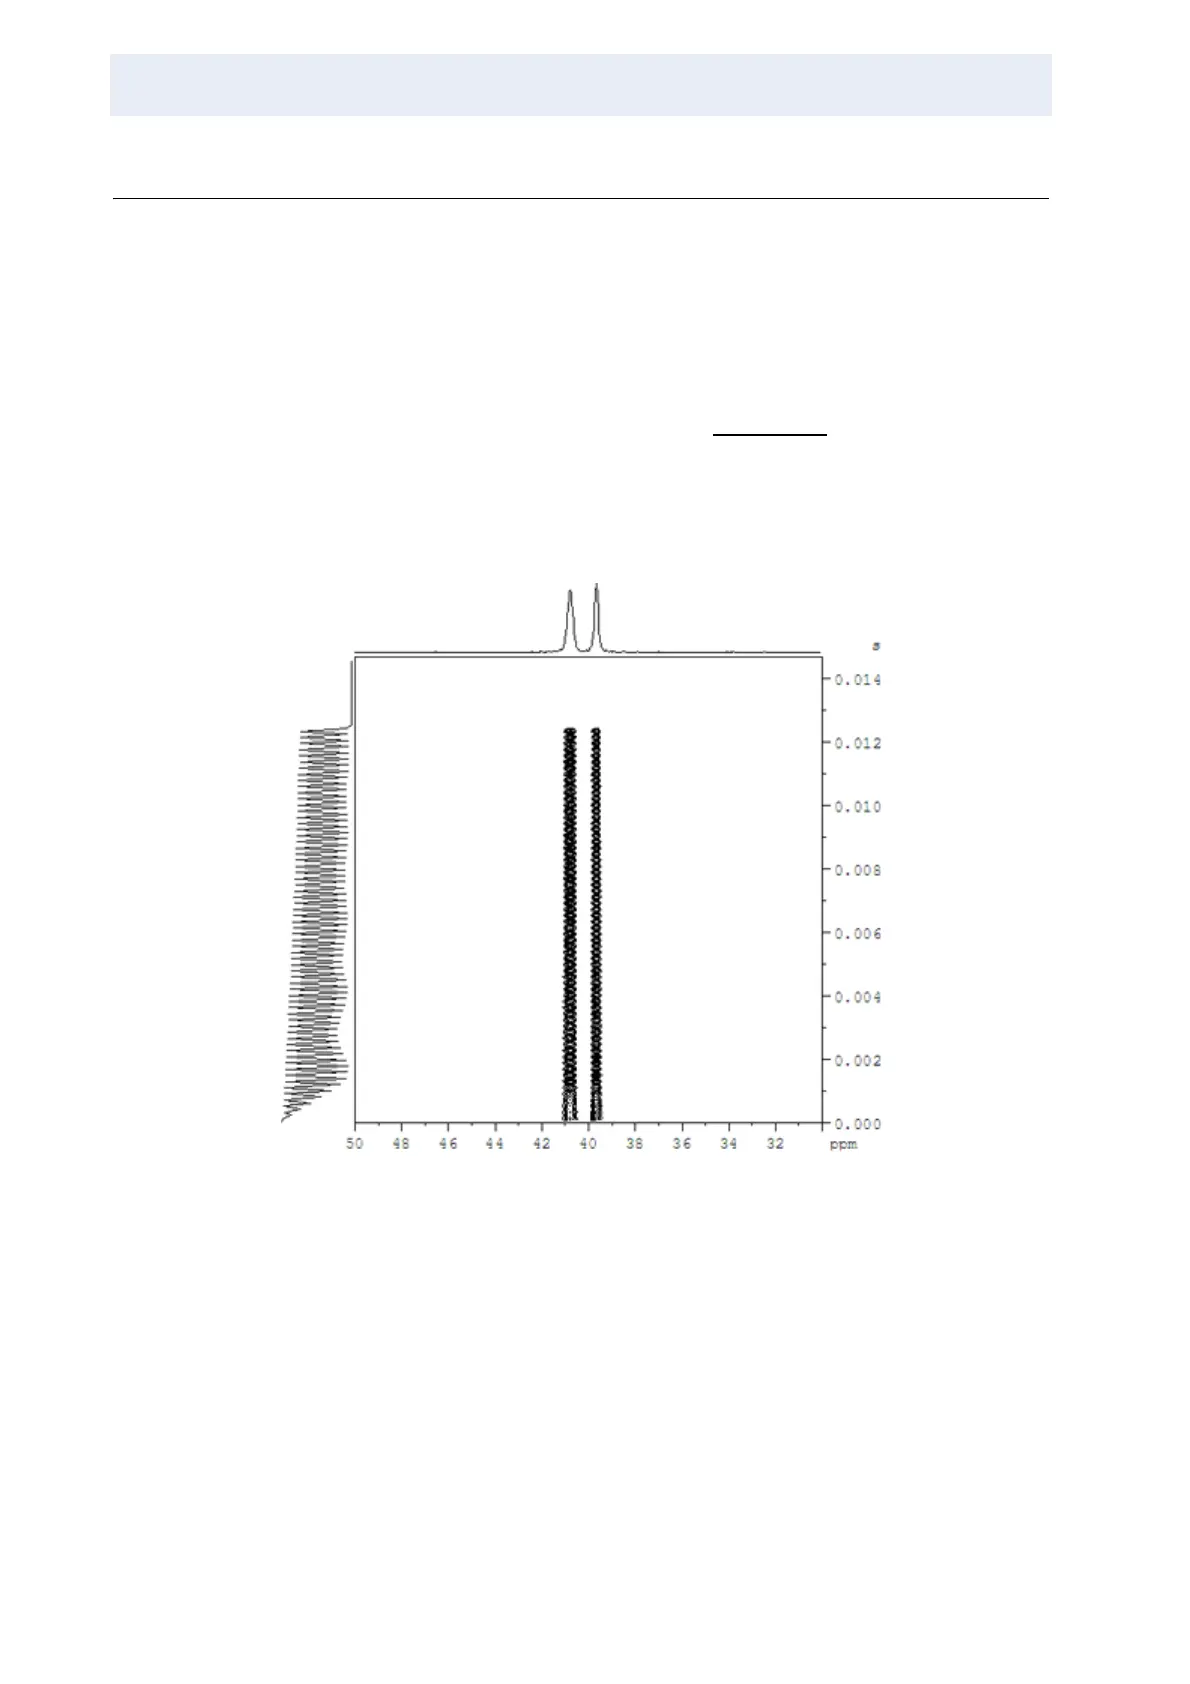
Figure 12.2. 2D data set after “xf2” processing.
In the figure above the data set contains the alternating S’ and S
0
experiments