EDASP Display: Software Controlled Routing
User Manual Version 002 BRUKER BIOSPIN 53 (327)
In the figures above is a “short” display, pulse routing only, for a C/N/H DCP or
REDOR experiment, observing C and observing N (without any hardware
change!). Green dots indicate CORTAB linearization.
13
C routed via 500W trans-
mitter since
13
C requires less power than
15
N.
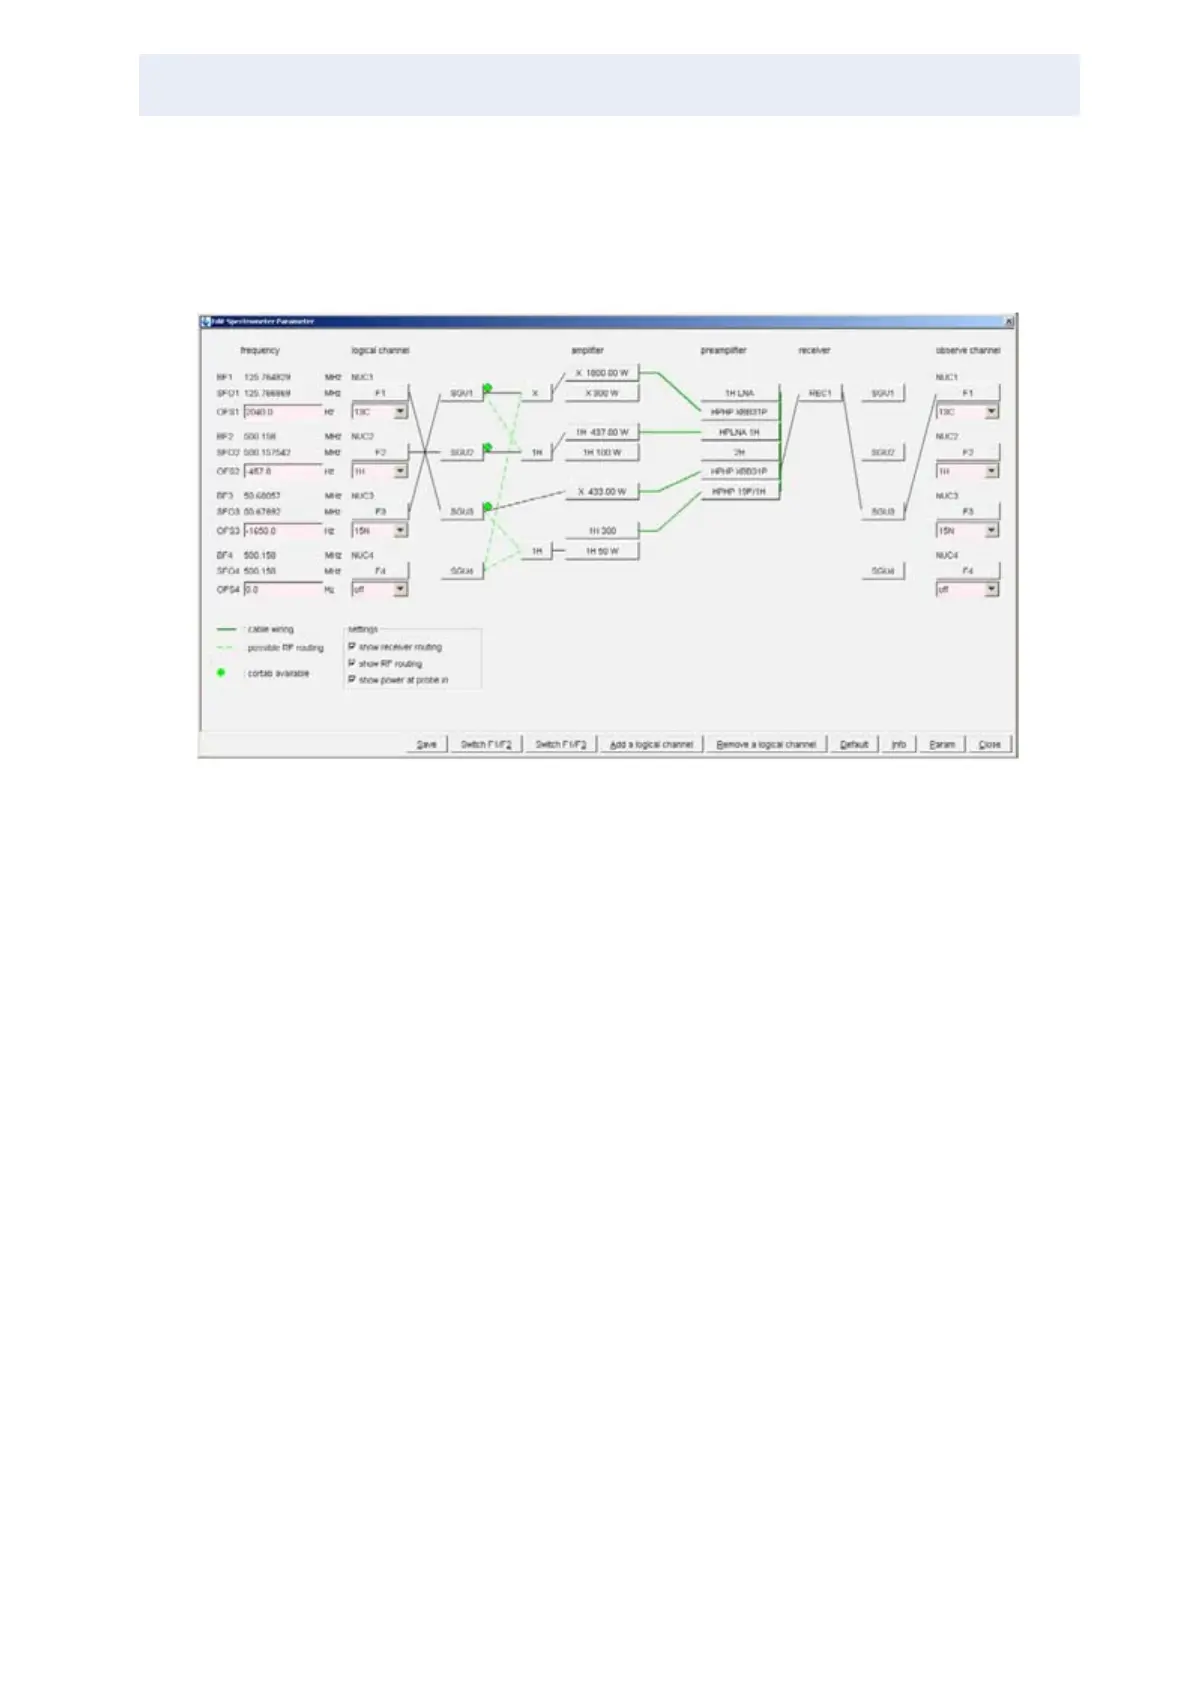
Figure 3.42. Long Display, Pulse and Receiver Routing
The figure above is a “long” display, with pulse and receiver routing:
• Green dots: CORTAB done for this path, transmitter linearized.
• Dotted green lines: Possible (hardwired) routing are shown (“show RF rout-
ing”).
• Receiver routing: SGU3 used for transmit and receive (“show receiver rout-
ing”).
• Power indication: Maximum possible power output (as measured, “show pow-
er at probe in”).