224 (327) BRUKER BIOSPIN User Manual Version 002
Basic MQ-MAS
Since the quadrupole parameters are usually unknown before performing the ex-
periment the positions of the peaks in the indirect dimension cannot be predicted.
Therefore, it may happen that a peak is positioned at the border of the spectral
range in the F1 dimension or even folded. When using xfshear the prompt “F1
shift in ppm:” can be used to shift the spectrum including its axis upfield (negative
value) or low field (positive value) accordingly. For data which don’t need a shear
-
ing transformation, the ppm axis in F1 can be correctly calibrated by running the
AU program xfshear with the option „rotate”. It will calibrate the F1 axis and per
-
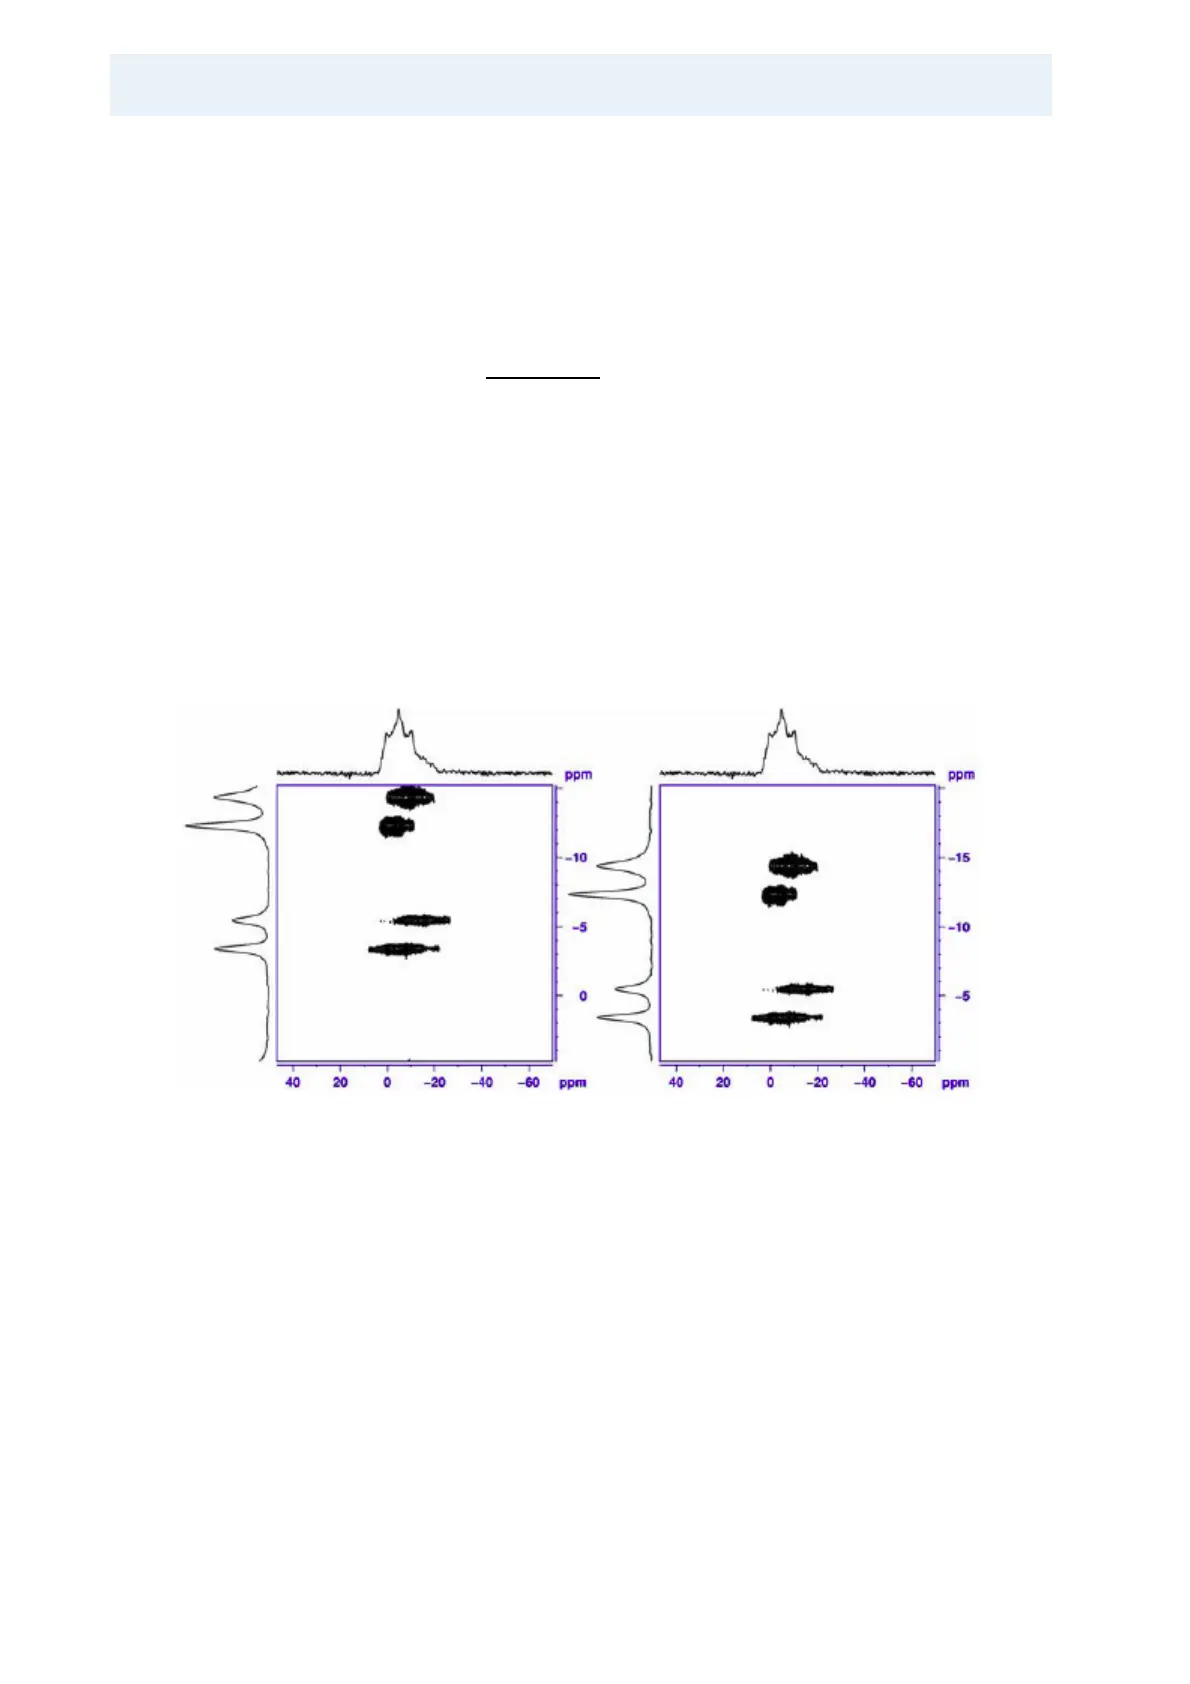
form the 2D FT. Figure 17.8. compares the same 2D 3Q MAS spectrum pro-
cessed with no shift and an additional shift of 5 ppm, respectively. We see that
without the additional shift, the uppermost peak is at the border of the spectral
range and the projection shows that the edge of this peak reenters into the spec
-
tral range from the opposite side. In summary the AU program xfshear can be
called with the following options:
lastf1: Use the F1 shift value from last processing
abs: Do abs2 after F2 Fourier transform of data
noabs: Don’t do abs2 after F2 Fourier transform of data
rotate: don’t calculate shearing, only use F1 shift to rotate spectrum along
F1 axis
ratio: Use different value for ratio R, value can either be entered or passed.
Figure 17.8. Comparison of Differently Processed 2D
23
Na 3Q MAS Spectra of
Na4P2O7.
The left spectrum was processed with an additional F1 shift of 0 ppm, the right
spectrum with +5 ppm. Spectra are taken on an AV500WB at a Larmor frequency
of 132.3 MHz with a 4 mm CP/MAS probe spinning at 10 kHz. Note that the F1
range equals the spinning frequency of 10 kHz in both cases.