228 (327) BRUKER BIOSPIN User Manual Version 002
Basic MQ-MAS
sodium metaphosphate NaPO
3
in the glassy state. The enrichment of
17
O is ap-
prox. 30 to 33%. It contains 2 oxygen positions: there are bridging oxygen (P-O-P)
and non-bridging oxygen (P-O-Na).
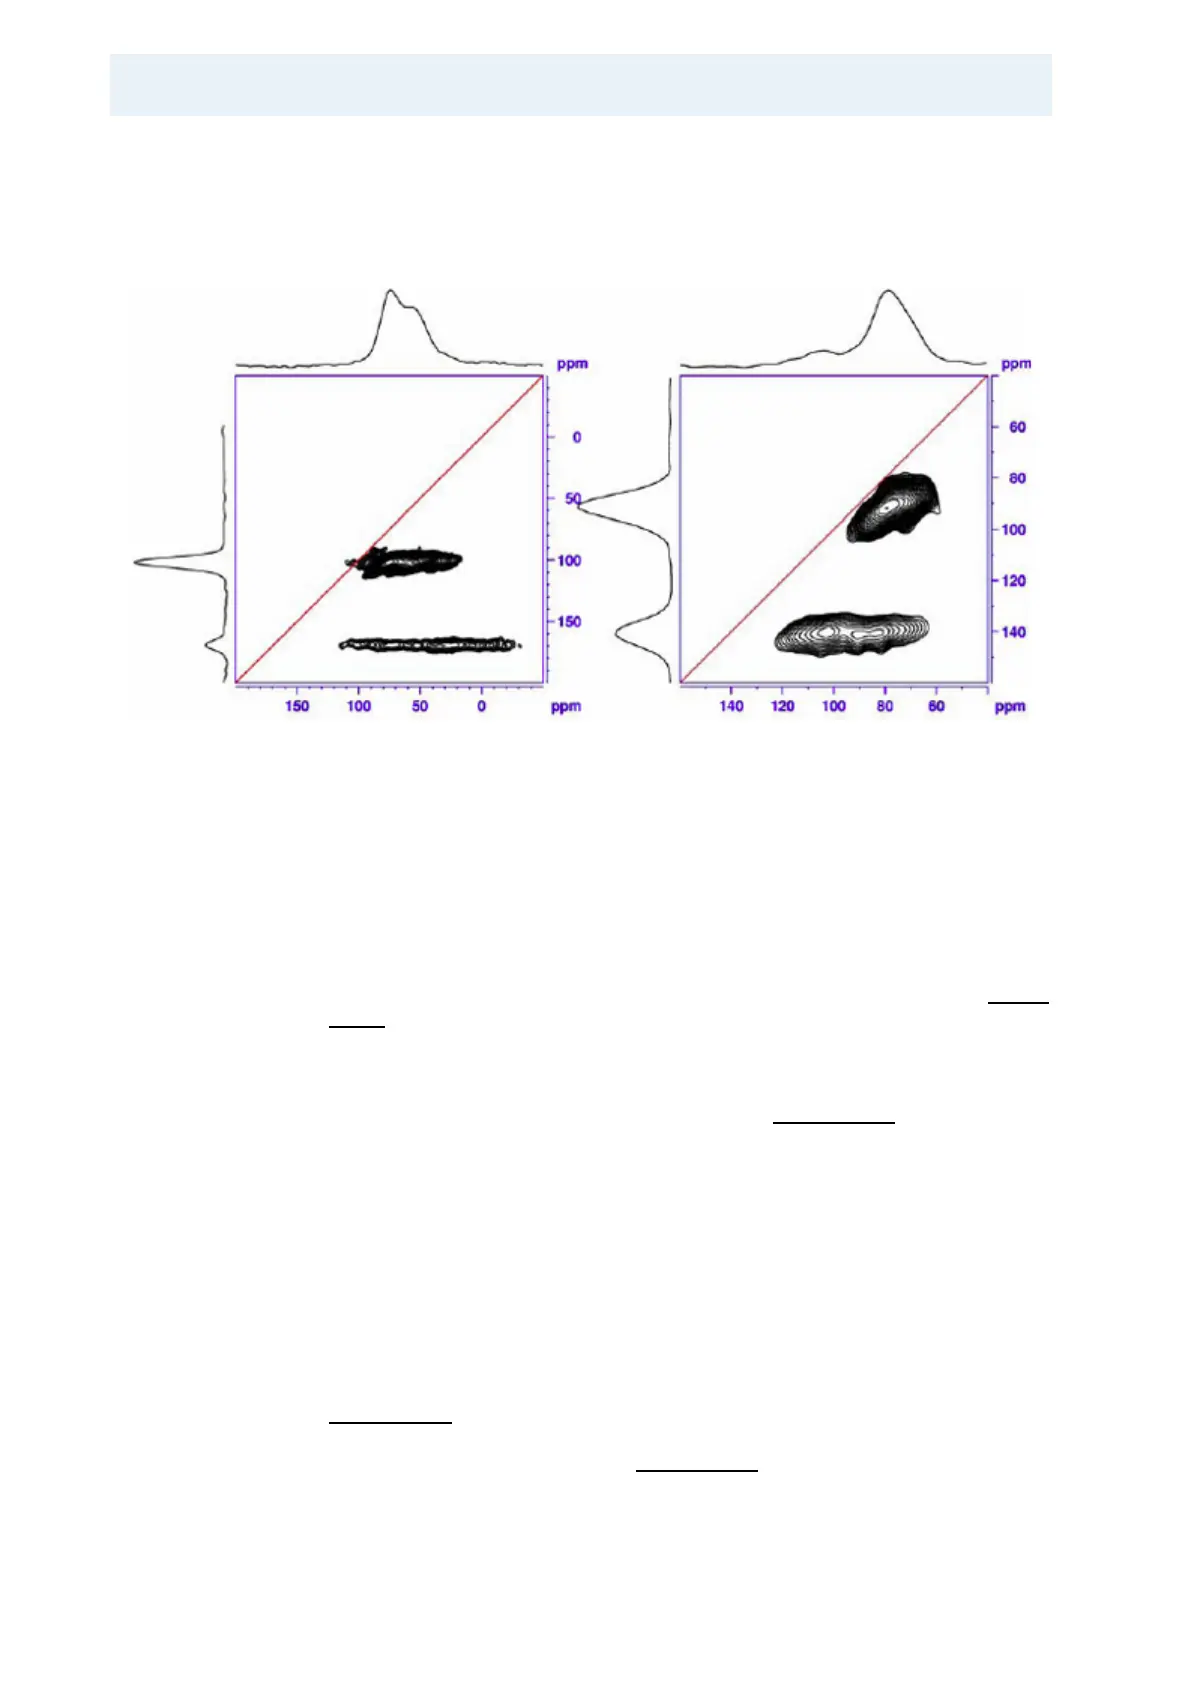
Figure 17.10.
17
O MQMAS of NaPO3 at 11.7 T (67.8 MHz) on the left and 18.8 T
(108.4 MHz) on the right.
The red lines in the spectra indicate the isotropic chemical shift axis. Approximate
quadrupole parameters of the two sites are Qcc ≈ 7.7 MHz, h ≈ 0.36, diso ≈ 125
ppm for the lower peak and Qcc ≈ 4.5 MHz, h ≈ 0.16, diso ≈ 85 ppm for the upper
peak (sample courtesy of Alexandrine Flambard, LCPS, Univ. de Lille).
The bridging oxygen give rise to the lower peaks in the 2D spectra of Figure
17.10., the non-bridging ones give rise to the upper peak. An additional red line is
drawn into the spectrum which represents the diagonal, meaning d(F2) = d(F1).
One can see that all line positions must be below this diagonal because the nega
-
tive quadrupole induced shift is scaled down and subtracted from the isotropic
shift to give the MQ shift. In the example shown in
Figure 17.10. two sites are vis-
ible with distinct differences in their spectroscopic parameters. In the sheared
spectra we find the lower peak at 170 ppm (11.7 T) and 140 ppm (18.8 T), respec
-
tively, in the 3Q dimension. This peak is dispersed parallel to the F2 axis which
means that its line width is mainly due to second order quadrupole broadening.
The upper peak at 100 ppm (11.7 T) and approx. 90 ppm (18.8 T) in the 3Q di
-
mension has a much smaller quadrupole coupling which can immediately be rec-
ognized from the fact that the peak is much closer to the diagonal. It is very nice
example where the second order broadening which is still the dominant interac
-
tion at 11.7 T is so much reduced at 18.8 T that the width of the peak is now deter-
mined by the distribution of chemical shift. This is expressed in the fact that the
peak is dispersed along the diagonal.
Figure 17.11. shows the results of the fitting with the solids line shape analysis
package included in TopSpin. The spectra used for that have been extracted from
rows of the 2D spectrum shown in
Figure 17.10..