User Manual Version 002 BRUKER BIOSPIN 245 (327)
19
STMAS 19
The STMAS experiment for half integer quadrupole nuclei is a 2D experiment to
separate anisotropic interactions from isotropic interactions. In the NMR of half in
-
teger quadrupole nuclei the dominant anisotropic broadening of the central +1/2
↔ –1/2 transition (CT), and symmetric multiple-quantum (MQ) transitions, is the
2
nd
order quadrupole interaction which can only partially be averaged by MAS.
The satellite transitions (ST, e.g. the ±3/2 ↔ ±1/2 transitions) however, are broad
-
ened by a 1
st
order interaction, which is several orders of magnitude larger than
the 2
nd
order broadening. Under MAS the 1
st
order interaction of the ST can be
averaged but spinning cannot be fast compared to the first order broadening (of
the order of MHz), a large manifold of spinning side bands remains. The 2
nd
order
broadening of the CT can only be narrowed by a factor of 3 to 4 so a signal is ob
-
served that still reflects this 2
nd
order broadening.
The 2D STMAS experiment exploits the fact that the 2
nd
order broadening of the
ST transitions (e.g. + 3/2 ↔ +1/2 in a spin 3/2), is related to the 2
nd
order broad-
ening of the CT by a simple ratio. A 2D spectrum is recorded which correlates a
single quantum coherence of the satellite transitions (usually one of the inner tran
-
sitions, ± 3/2 ↔ ± 1/2), and the + 1/2 ↔ –1/2 single quantum coherence of the
central transition. The resulting 2D spectrum yields an isotropic projection where
the 2
nd
order broadening has disappeared. The information content is in full anal-
ogy to the MQMAS experiment.
Experimental Particularities and Prerequisites 19.1
In contrast to the MQMAS experiment the first pulse in the STMAS experiment ex-
cites single quantum (SQ) coherency. The signal which is thus generated consists
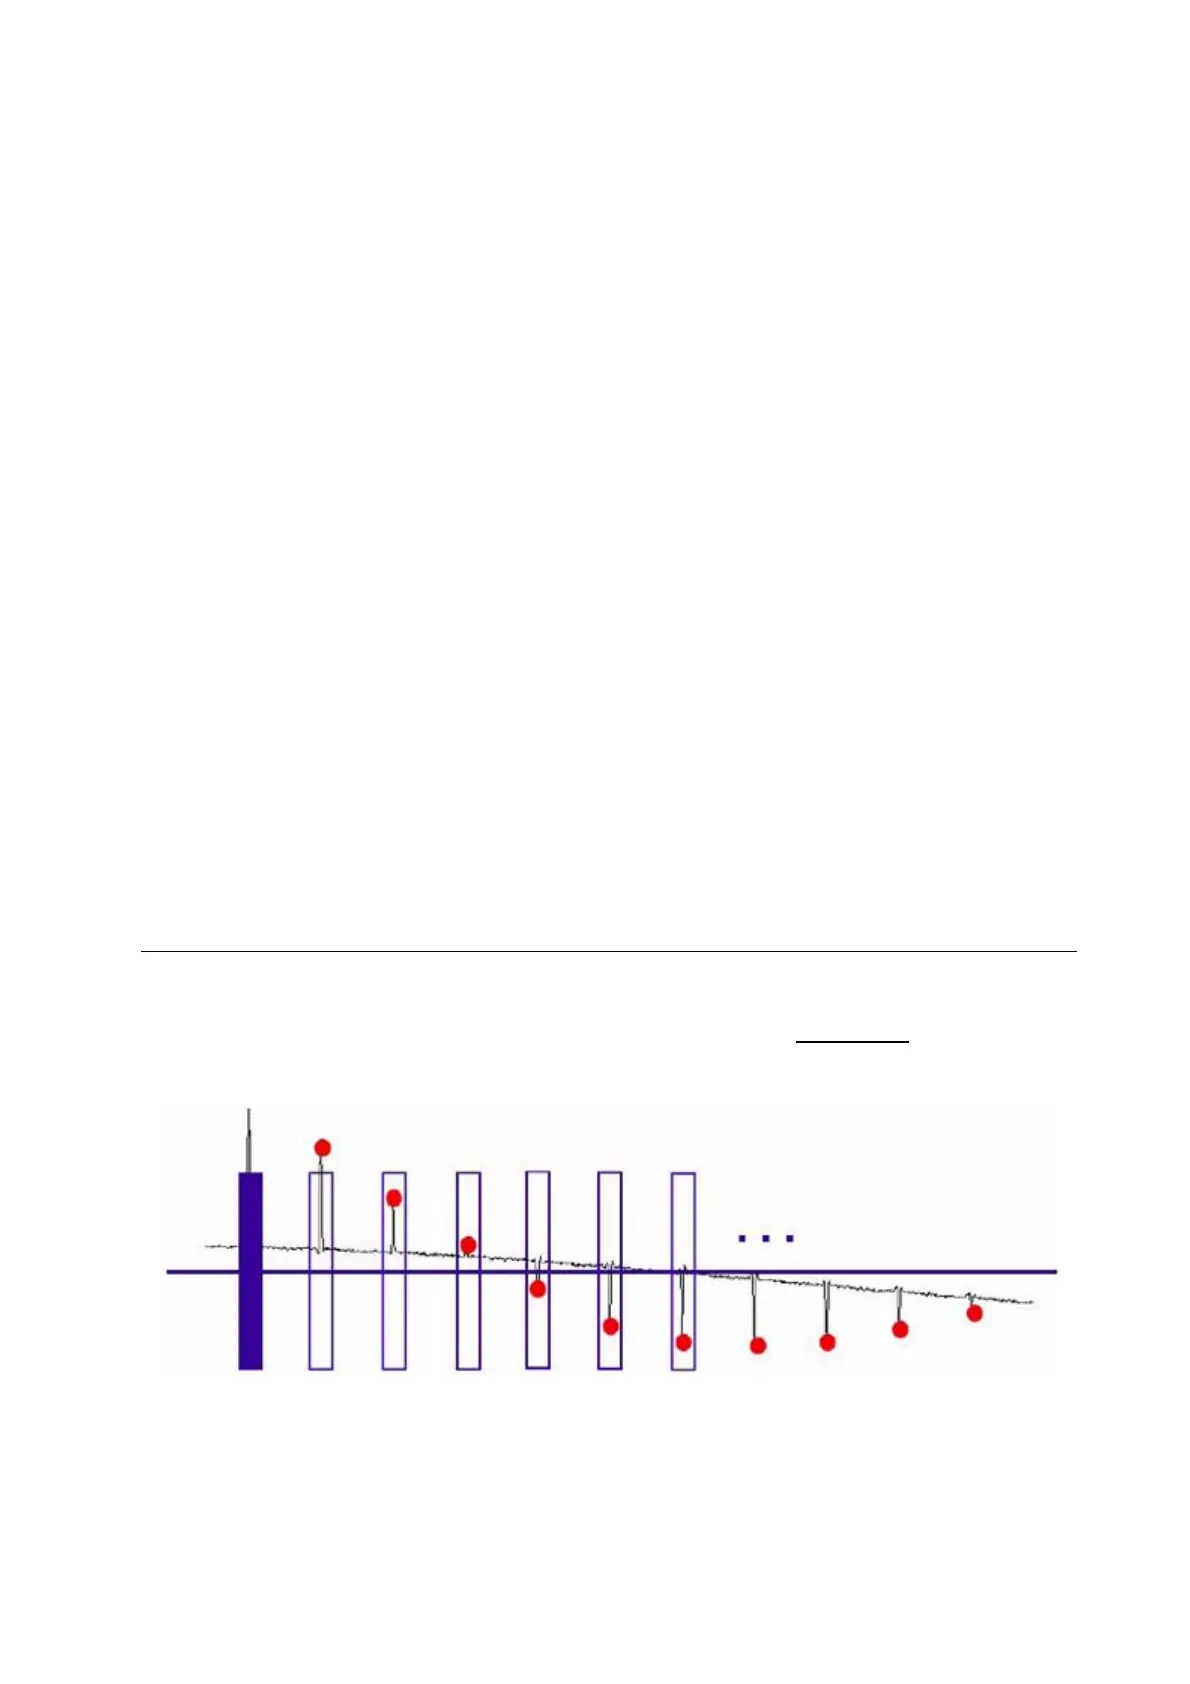
of contributions from both the CT and the ST. In
Figure 19.1. the contribution of
the CT shows up in the cosine curve starting at the (blue) filled rectangle resem-
bling the initial pulse.
Figure 19.1. Principle of 2D Data Sampling in STMAS Experiments.
The (blue) filled rectangle on the left symbolizes the first pulse, which starts the
evolution period t
1
. After each revolution of the rotor, rotational echo’s show up