Symmetry Based Recoupling
User Manual Version 002 BRUKER BIOSPIN 185 (327)
Both times were incremented in units of 2 rotation periods. One can clearly see
the different maxima for the C
a
, the alphatic carbons and the mobile CH
3
-groups.
Spinning speed was 13 kHz.
7. Optimize the cwlg decoupling if needed by variation of cnst20 in increments of
5000 and check whether a different offset condition helps improving the signal
intensity.
8. Run one experiment and compare with the direct CP experiment to measure
the DQ recoupling yield.
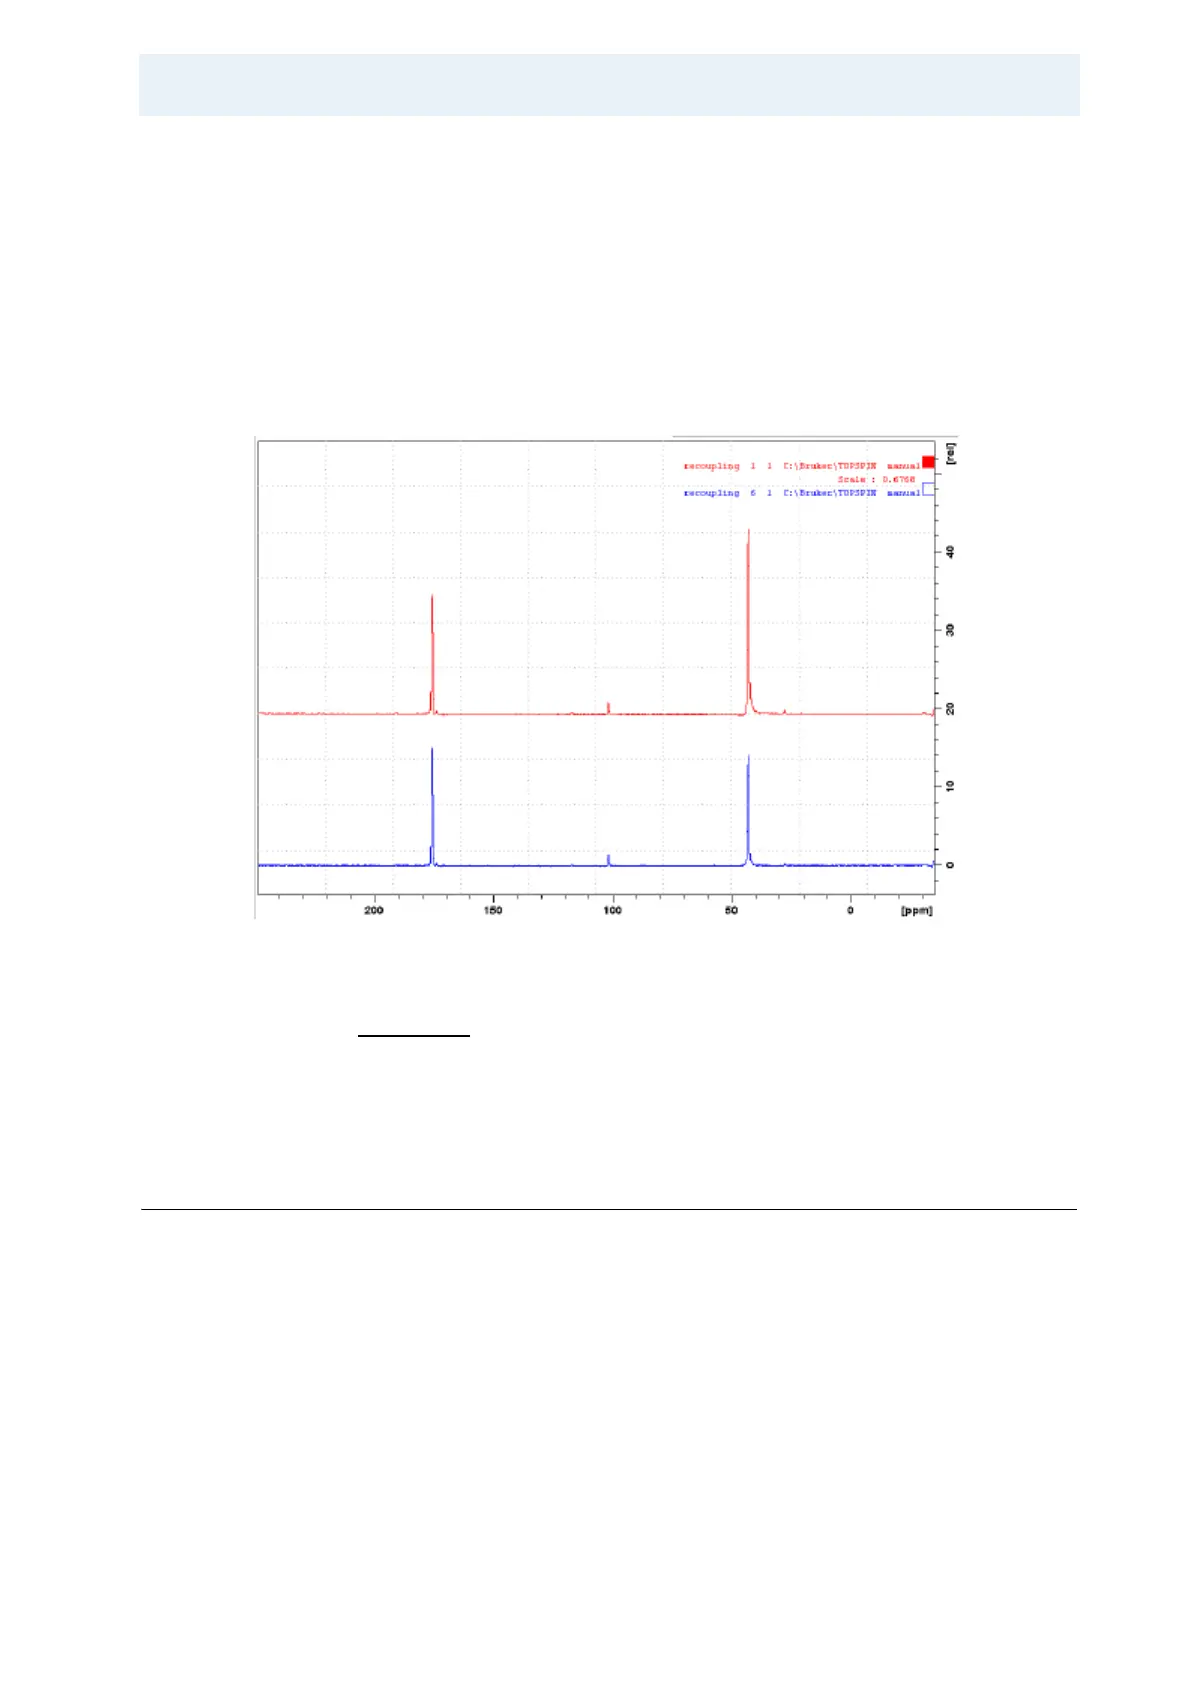
Figure 14.4. PC7 Recoupling Efficiency at a Spinning Speed of 13 kHz
Figure 14.4. illustrates PC7 recoupling efficiency at a spinning speed of 13 kHz
(about 100 kHz RF field), using a 2.5 mm probe. LG decoupling at 125 kHz was
used during DQ generation/reconversion. Quite a noticeable loss on the glycine
α-peak due to insufficient HH suppression is visible. Efficiency is 67% on the car
-
boxyl peak (AVIII 700 SB).
Setup of the 2D SQ-DQ Correlation Experiment 14.2.3
9. Running such a correlation experiment on glycine makes little sense, so insert
a sample with more 13C sites (fully labelled tyrosine-HCl, or histidine or any
other suitable labelled sample). Optimize l0 for the best compromise in signal
intensities.
10. Generate a new data set, set the mode to 2D using the 123 button in eda.
Load the pulse program spc5cp2d.
11. Make sure
13
C is selected as nuc1 in the F1 dimension, set FnMode
=STATES-TPPI.