368 Hog 4 Operations Manual
20.3.5 Shapes
Shapes are simple plot objects that have various fill and outline options and can also display
text. The supported image formats for filling shapes include JPG, PNG, BMP, and TIFF. In
this section we will discuss how to add / remove and edit shapes in plots.
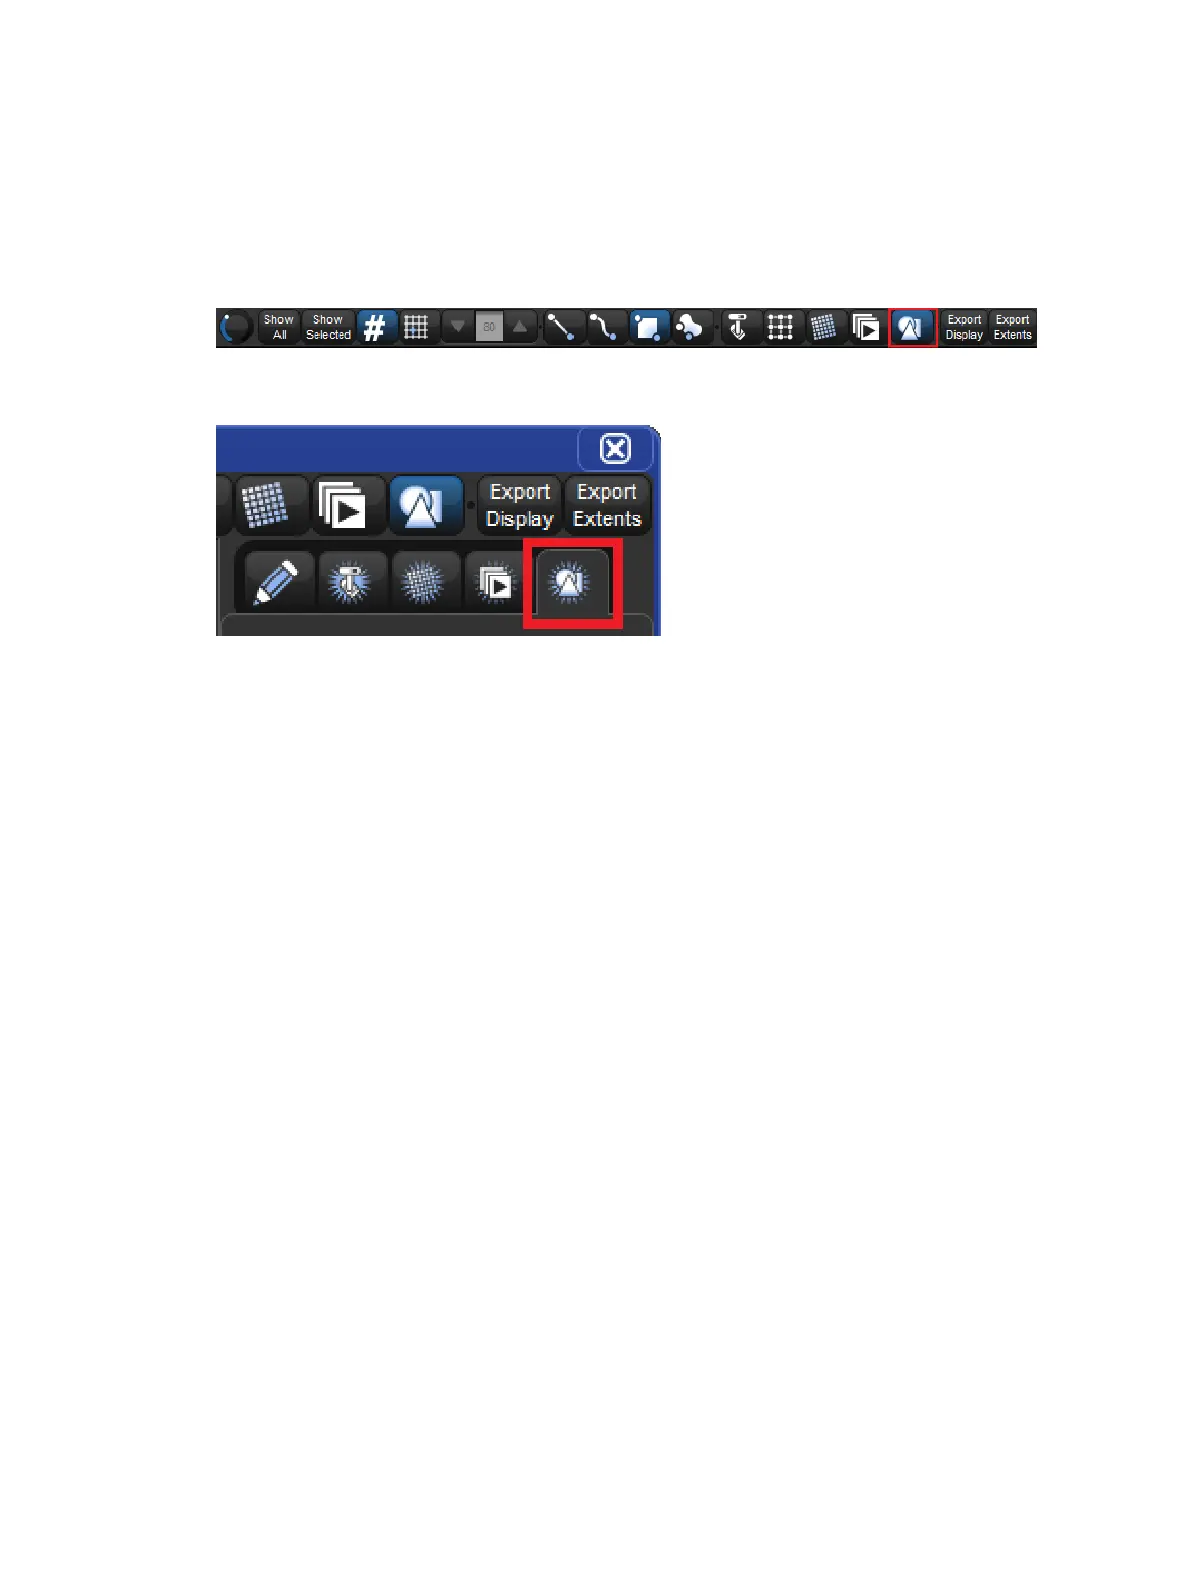
To add a shape to a plot:
1. Enable the shape edit button at the top of the plot window.
1. Click on the add shape tab of the properties pane located on the right side of the plot
window.
1. Touch (or left click) and drag across the plot window to draw a default rectangle shape.
2. Once the default rectangle shape is added to the plot it can be changed to any shape
using the properties pane located to the righ of the plot window.
To remove a shape:
1. Enable the shape edit button at the top of the plot window.
2. Select the shape you wish to delete.
3. Press the De lete button in the properties pane located on the right side of the plot
window.
To edit a shape (change its properties):
1. Enable the shape edit button at the top of the plot window.
2. Select the shape you wish to edit.
3. Use the properties pane located on the right side of the plot window to adjust the
shape's position, size, rotation, fill colour, border colour (this also affects the label
colour), label, image assignment, etc. You can also re-size and rotate the shape using
the blue object handles that appear when the shape is selected (circle handle for
rotation / square handle for resizing from center / _| handle for resizing from the top left
corner).
Assigning a fill image to a Shape:
To assign a fill image to a shape:
1. Enable the shape edit button at the top of the plot window.
2. Select a shape to edit.
3. Press the "select" button in the properties pane for the "image" attribute.
4. An Image File dialogue box will appear. Select an image from the list of images and
press okay. If images are not listed in the Image File dialog box, then proceed to
Importing Images from a USBFlash Drive for details on how to import images into
the show.