v 2.0 — March 2023 Altanium Delta5
100 Temperature Graphs Screen
The column information of the Cross Talk screen is described in Table 8-4.
To see the cross talk information, do the steps that follow:
1. On the Test Results screen, select the zones to compare.
NOTE: A maximum of 10 zones at a time can be selected and compared.
2. Touch the Cross Talk button.
8.4 Temperature Graphs Screen
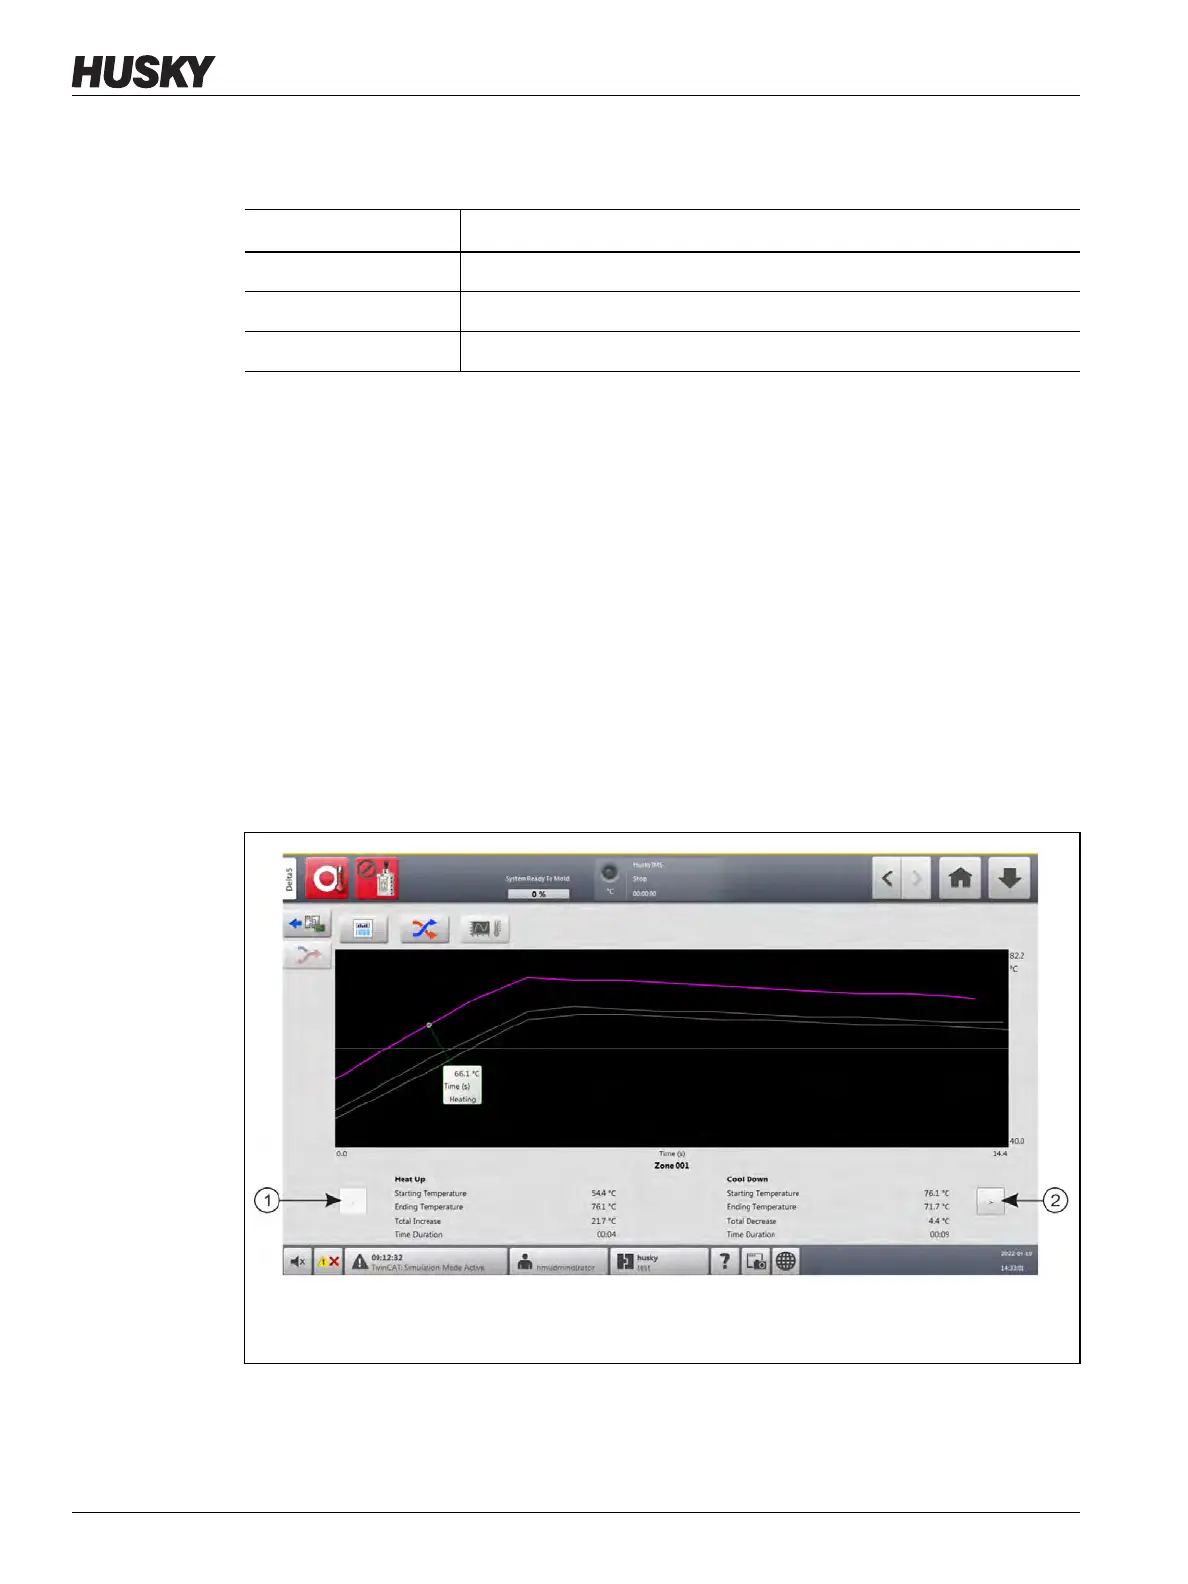
The Temperature Graphs screen has a graphical trace for each zone that shows the
temperature rise during the full test. Refer to Figure 8-4.
To open the Temperature Graphs screen, touch the Temperature Graphs button on the Test
Results screen.
Table 8-4 Cross Talk Screen Column Information
Item Description
Zone Shows the zone number.
Name Shows the name of the zone.
Cross Talk Shows the percentage of cross talk between zones.
Figure 8-4 Temperature Graphs Screen
1. Previous Button 2. Next Button


 To Next Page