142 Instruction Manual QuickTOC
®
ultra
IECEx 12E5119
7 How to Work with the Analyser
7.10 Calibration LAR | PROCESS ANALYSERS AG
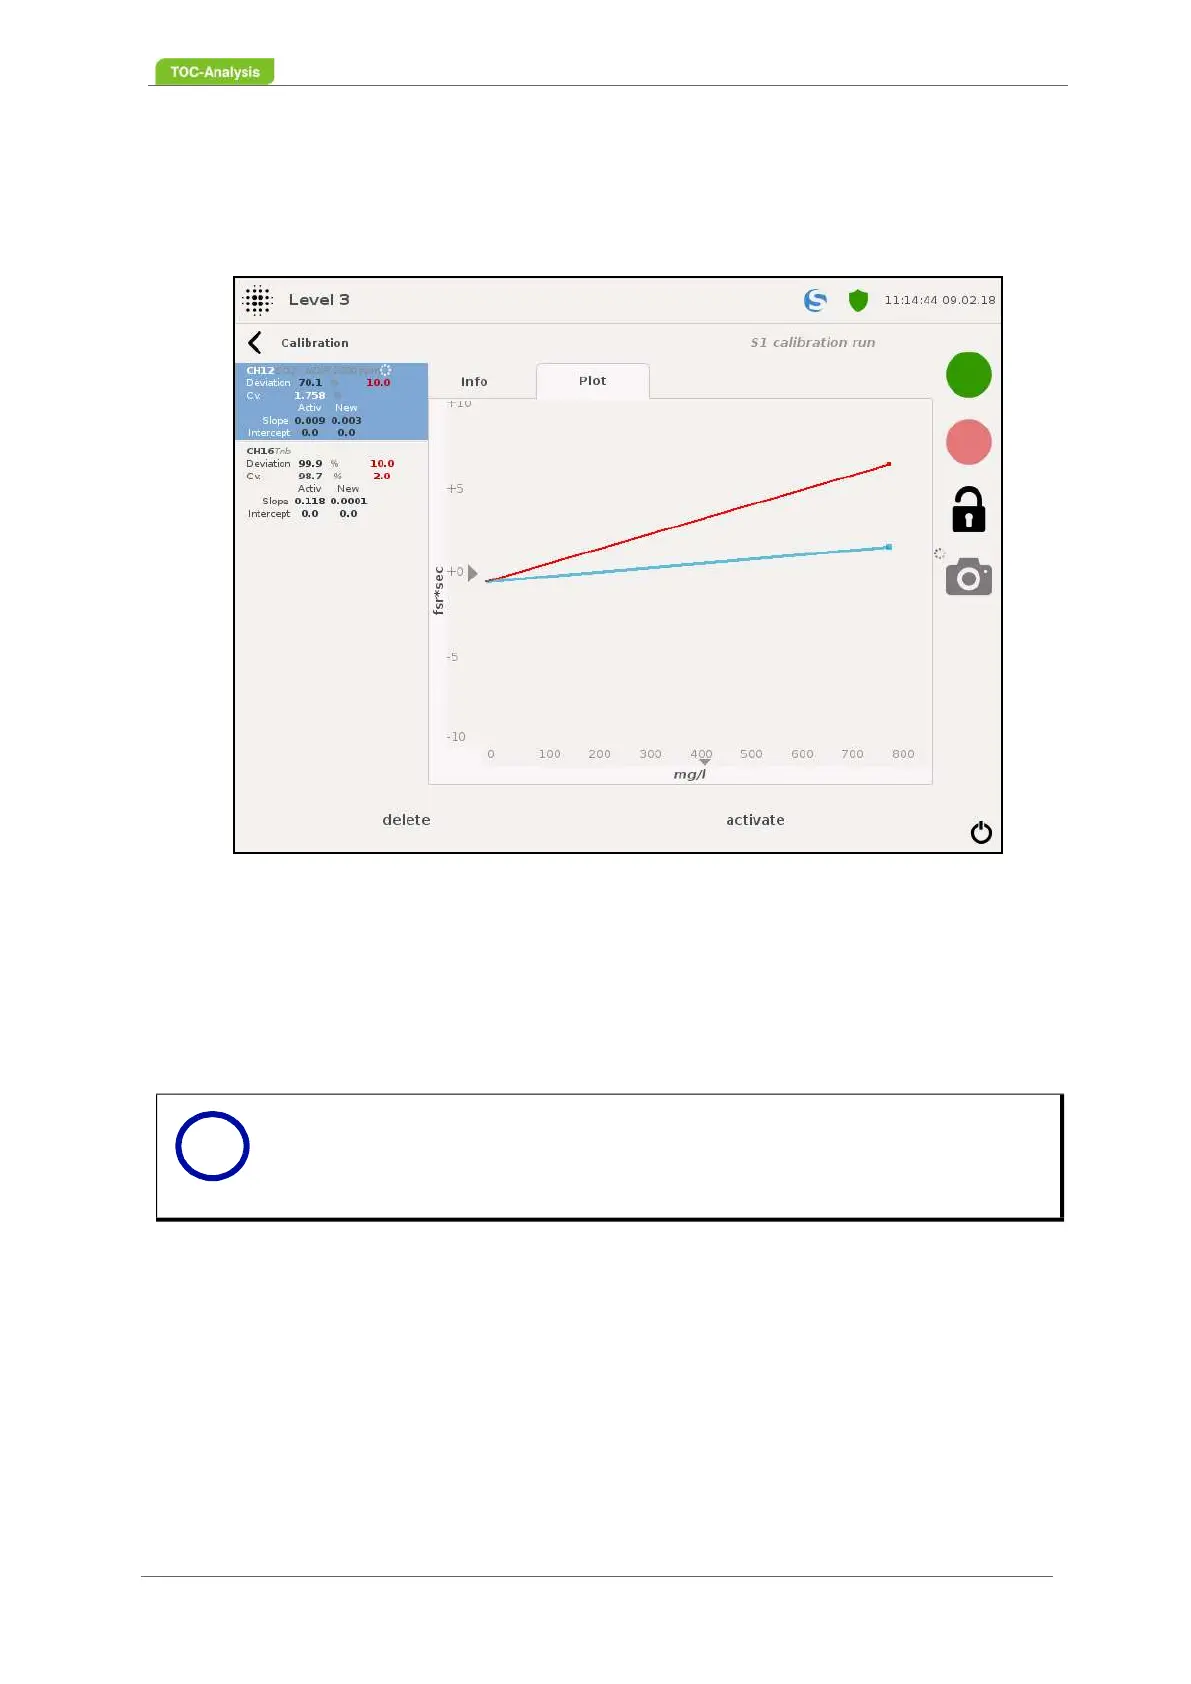
7.10.3 Carrying out the Calibration - Graph
This display shows the calibration graph of the currently set calibration.
Color coding of the calibration graph:
Red line:
This line indicates the currently set calibration.
Blue Line:
This line indicates the newly performed calibration.
Fig. 104: Carrying out the Calibration - Graph (Example)
Notice
This view supports the zoom funcionality (Chapter 7.14.1 on page 155).
i