148 Instruction Manual QuickTOC
®
ultra
IECEx 12E5119
7 How to Work with the Analyser
7.11 Database LAR | PROCESS ANALYSERS AG
time span is always given from 23:59 to 23:59.
Table of measured values:
This function takes you to the display of the measurement results as a table.
Single view of the channel:
Pressing the graphic display will take you to an enlarged view of the graphic.
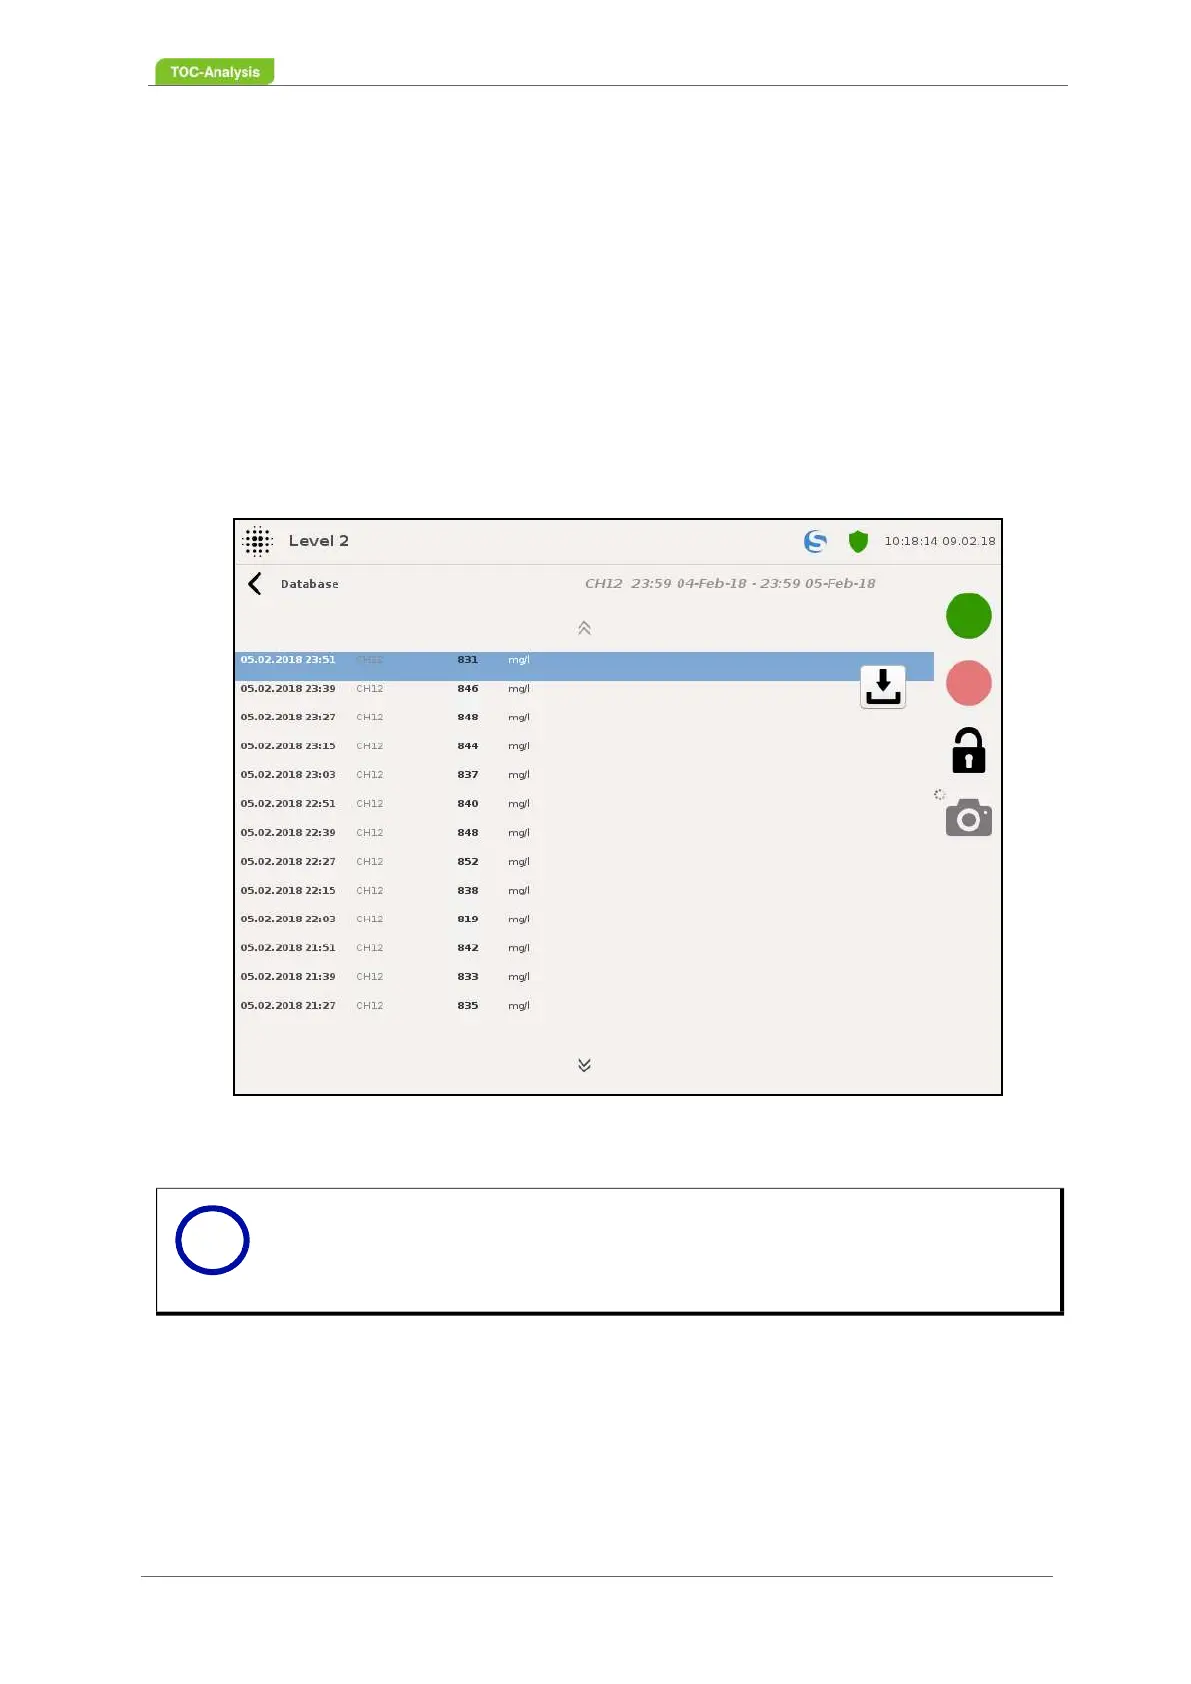
7.11.1 Table of Measured Values
In this table, the individual measurement results are sorted from top to bottom in descending order of
date and time. The measurement results are output in mg / l. When you press a measurement result you
get to the single view of the measured value.
Fig. 107: Table of measured valures (Example)
Notice
This view supports the Export function (Chapter 7.14.2 on page 156)
Only the measurement results of the period previously set in the "Database"
display are shown.
i