150 Instruction Manual QuickTOC
®
ultra
IECEx 12E5119
7 How to Work with the Analyser
7.11 Database LAR | PROCESS ANALYSERS AG
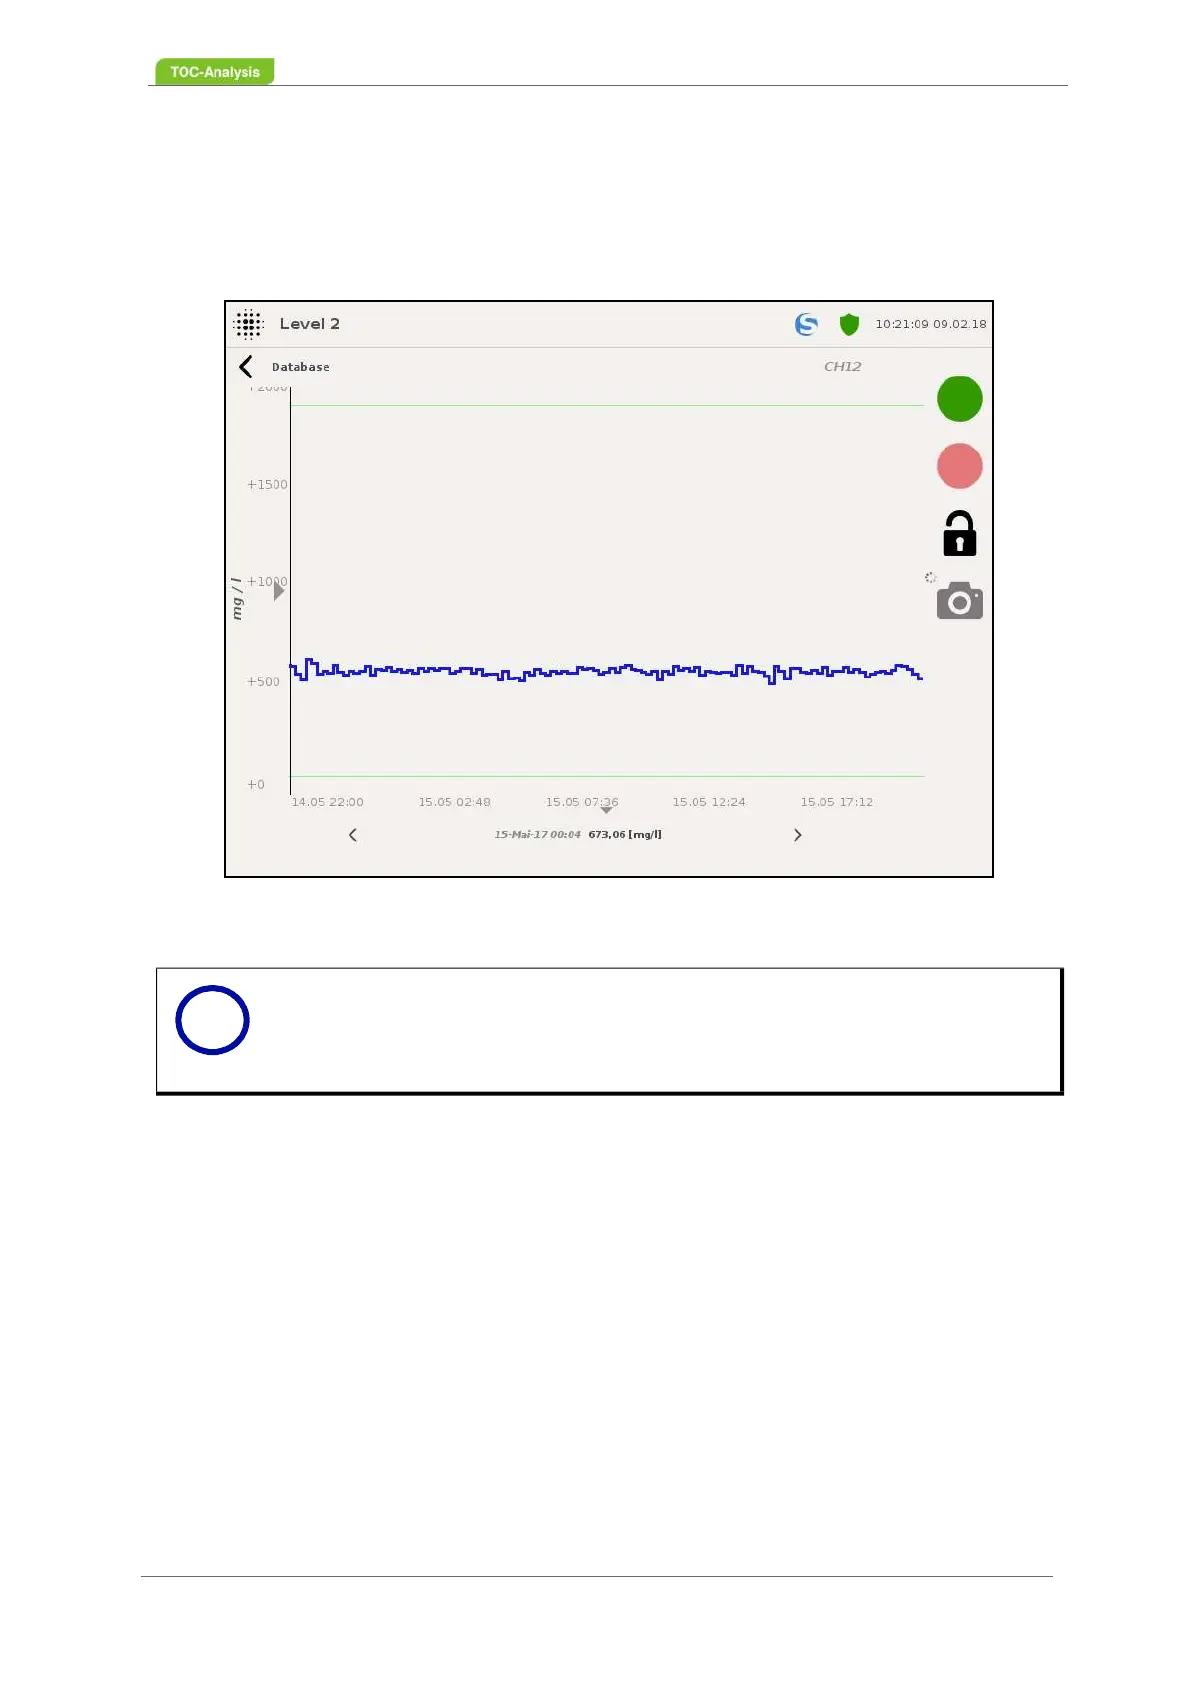
7.11.2 Single view of the channel
Below the graph you will find the measurement result with the date and time of the measurement. With
the arrows left and right below you can jump to the previous or next measurement result. The black bar
represents which measurement result is currently being considered.
Fig. 109: Single view of the channel (Example)
Notice
This view supports the zoom funcionality (Chapter 7.14.1 on page 155).
i