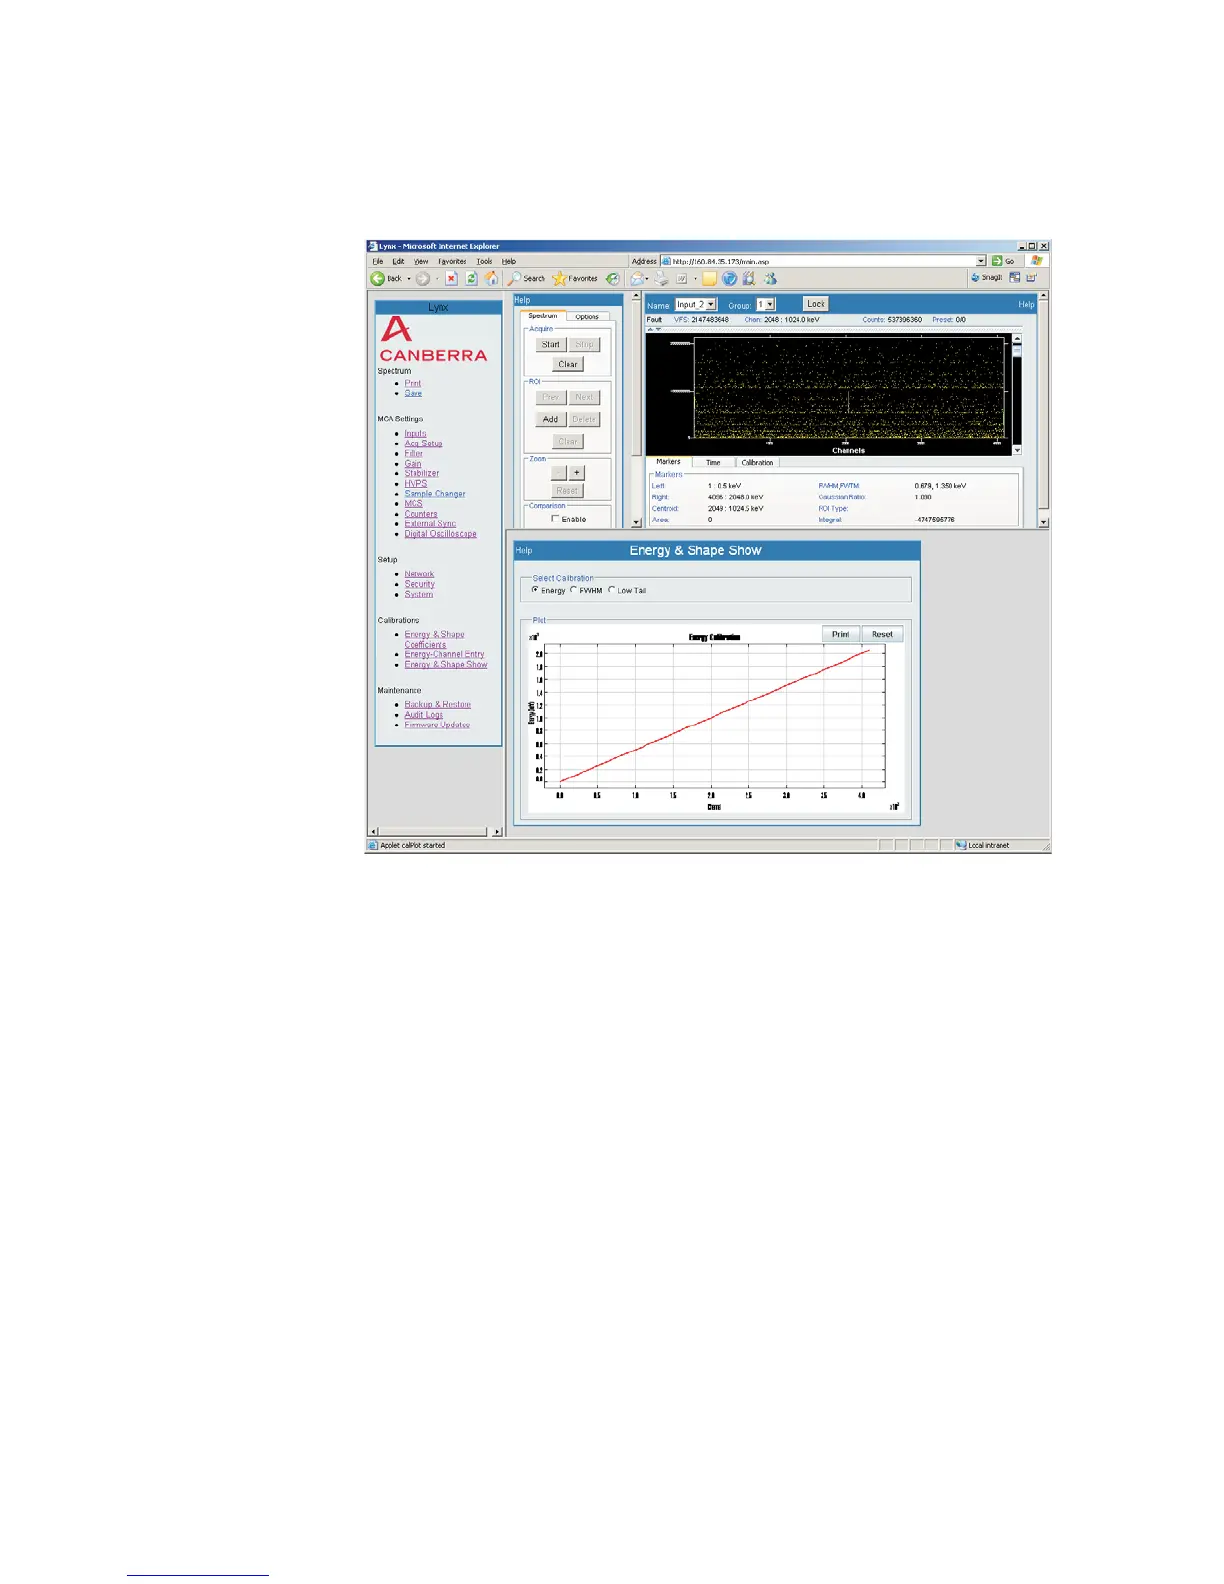
Energy & Shape Show
This option displays the energy calibration in a plot.
You can select the calibration to view by choosing the radio button for Energy,
FWHM or Low Tail. When selecting a different Calibration option, this page will re
-
fresh automatically.
A copy of the calibration may be printed by selecting the Print button. When selecting
the Print option, you may be prompted to allow the print operation to proceed.
Zoom
The plot region supports zooming, using the familiar 'rubber rectangle' to highlight the
area to zoom on. To Zoom, simply press the left mouse button while over the plot and
drag the mouse. The rubber rectangle appears; lift the left mouse button to zoom into
the region within the rubber rectangle.
The original plot limits are reset by pressing the Reset button (next to the plot).
User’s Manual 131
Energy & Shape Show | Zoom Calibrations
Figure 99 - Example of an Energy & Shape Show plot