•
The Comparison group provides the ability to compare the spectrum of two
inputs or groups. This is done by overlaying the spectrum on a single plot.
Color selection options allow the two plots to remain distinct on-screen.
•
An expand window is available by pressing the down arrow on the top left
part of the plot; this will cause two plots to be shown, one with closer focus.
Use the up arrow between the two plots to reduce the expanded view. An
example of the Expanded View and its control is shown in Figure 53.
Lynx supports two Input sources, which may be viewed individually or may be com
-
pared to each other. The spectral display is designed to be color-coded to increase
on-screen readability and to highlight Regions Of Interest (ROIs) of acquired data.
Other Spectrum Controls
The display provides a real-time summary of its status, listing the Markers, Time and
Calibration settings on tabbed areas below the graphical display. This data is also
provided to printed reports, if you are using a printer in your application.
The following additional controls are present on the spectral display window:
Input selection
This region provides controls to select the input and memory group to view or con-
trol. The Unlock/Lock button will show this input's current status, and if locked, it
identifies which User is using this input, to prevent accidental intrusion on a setup.
Lock / Unlock / Take-Over
When you start an acquisition, it will automatically be 'locked' for your use, to prevent
inadvertent changes or intrusion in your acquisition by other users.
A User with 'Take Over privileges (see page 120) can 'take over' an acquisition of an
-
other user by simply selecting that Input and selecting the Unlock button.
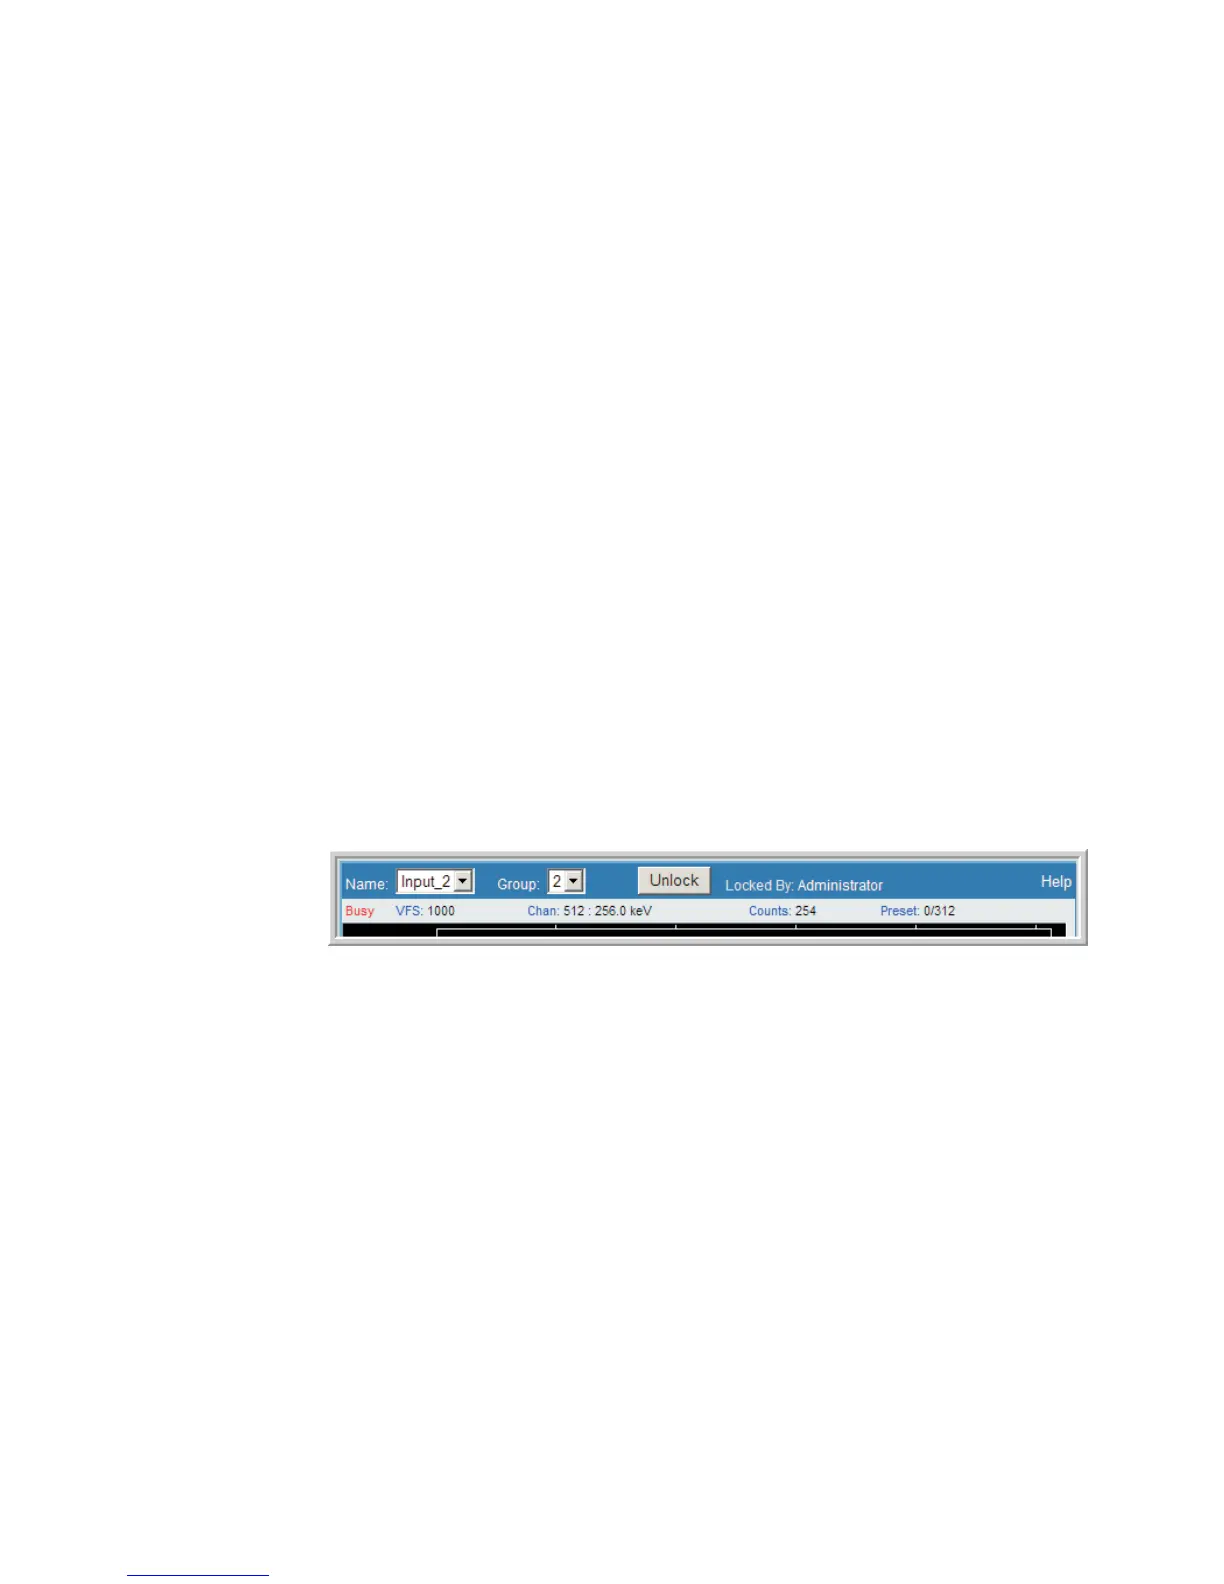
Status region
The status area at the top of the spectral display, but below the Input selection field
(see Figure 54) shows the current 'status' of your acquisition. This information in
-
cludes cursor position relative to the channel, and the Energy at that point, the acqui
-
sition state (idle, waiting, busy, fault, etc.), and current elapsed time or sweeps results.
User’s Manual 67
Spectrum Controls | Status region MCA Spectral Display
Figure 54 - Spectrum Controls (those across Top of Spectrum display) and Status