MCA Spectral Display
The spectral display is essential to the Lynx web site. An input's spectrum is viewed
on your browser's pages, with its configuration maintained in real time on the Lynx
system, for acquisition control and calibration from any web-enabled computer.
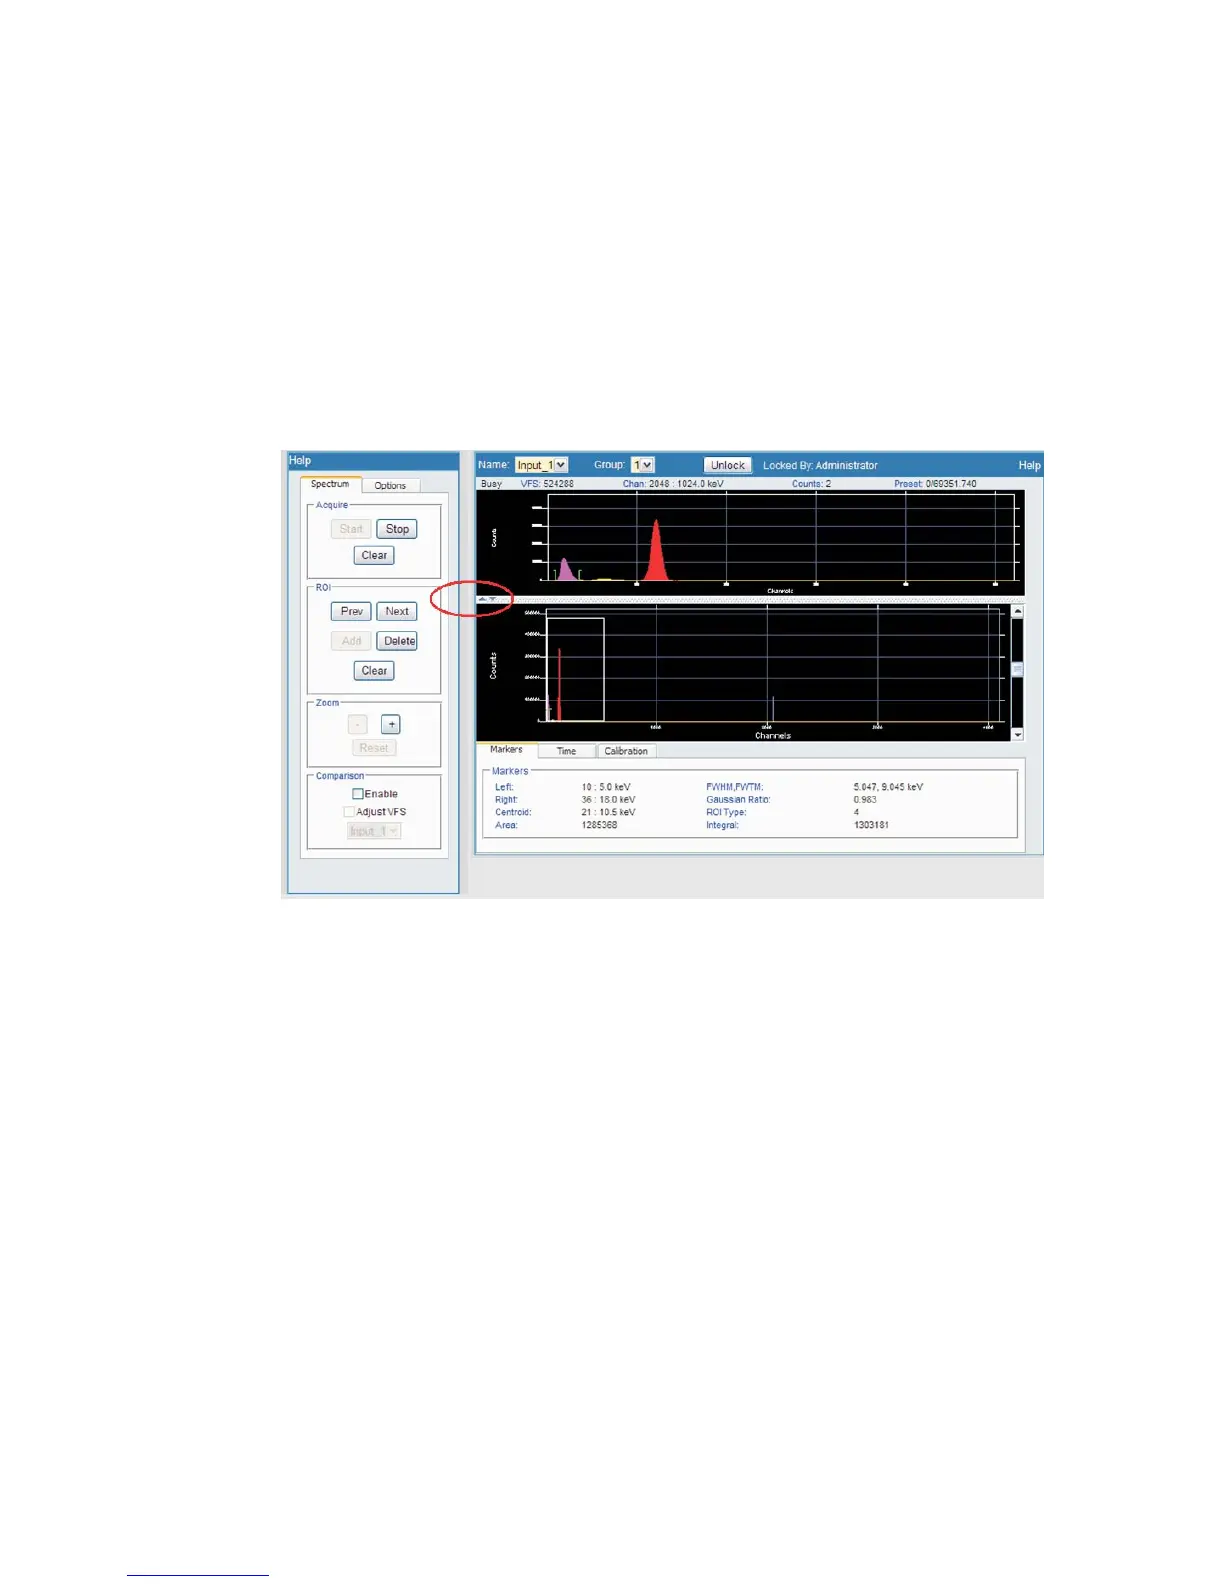
Spectral plot
This region displays the spectral data in a plot. The plot supports peak and ROI
cursors. Regions of interests can be added, deleted, or cleared.
Spectrum Controls
Spectral display parameters are grouped into four areas under the Spectrum tab:
•
Acquire provides Stop and Start buttons to control the acquisition mode. If
Start is selected, spectral data will be acquired. If Stop is selected, data will not
accumulate. The Clear button will reset and clear the existing acquisition.
•
The ROI group provides capabilities of moving the ROI cursors amongst all
ROIs defined, adding, deleting, and clearing ROIs. All ROIs are saved upon any
change provided input is locked or currently not owned by another user.
•
The Zoom region provides the ability to zoom into or out of regions on the
spectrum. Pressing the '+' changes the x-axis limits by a factor around the
current peak cursor location. Pressing '–' zooms to the previous zoom limits.
Reset resets the plot limits.
Chapter 4 - Web-based Operation MCA Spectral Display
66 Lynx™ Digital Signal Analyzer
Figure 53 - Expanded Spectral display - Controls to left, Expand control is circled