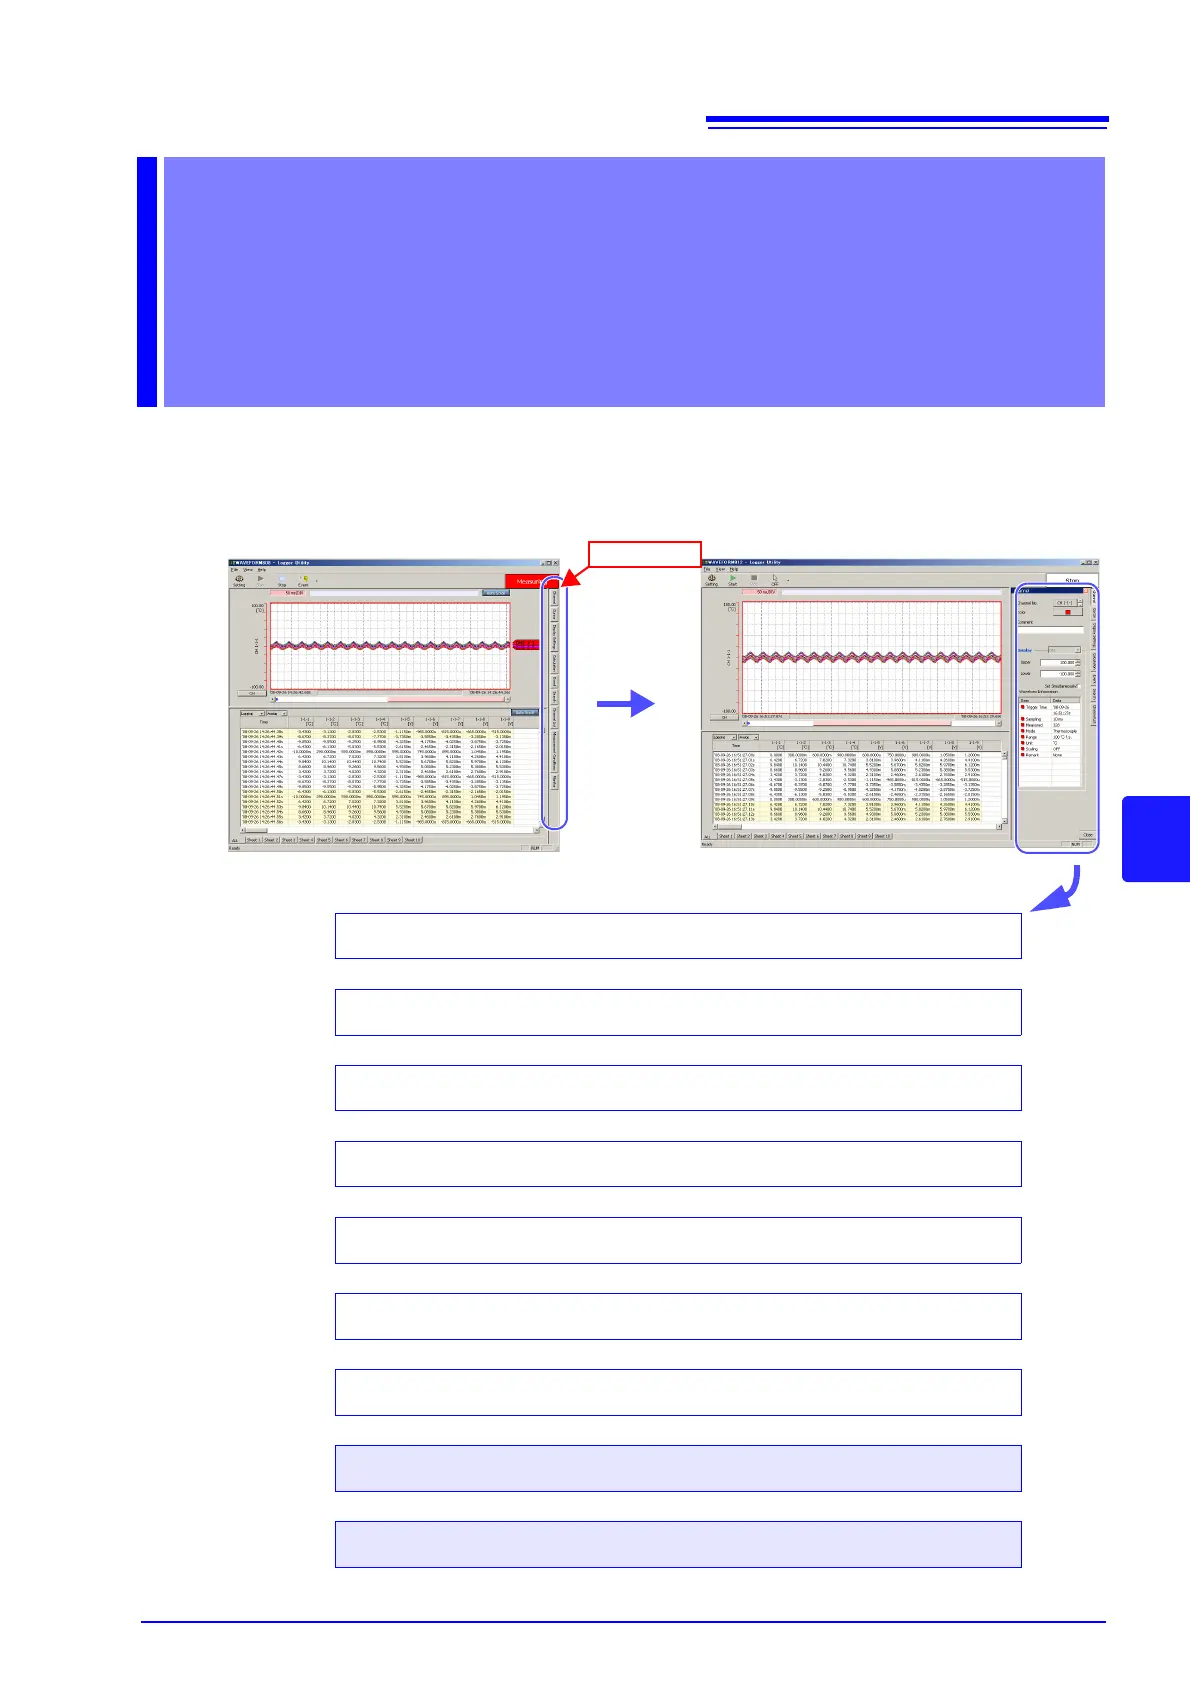
dow. These windows allow for configuring the advanced settings of the wave-
Click
[Channel] tab:
Changing the Waveform Display Range (p. 140)
[Cursor] tab:
Check the measurement values at the locations of the cursors A and B (p. 141)
[Display Setting] tab:
Configure the display settings of the main screen (p. 142)
[Calculation] tab:
Calculate the maximum value and minimum value of a waveform, etc. (p. 150)
[Event] tab:
Event Mark Function (p. 153)
[Search] tab:
Add a mark to a waveform or search for a mark (p. 155)
[Channel List] tab:
Display the display color of each channel (p. 159)
[Measurement Conditions] tab:
Display the measurement start time, number of data items, etc. (p. 160)
[Monitor] tab:
Display the instantaneous value of each channel (p. 161)
During measurement
only
Display Settings Windows
During measurement
only