Gocator Line Profile Sensors: User Manual
Gocator Web Interface • 171
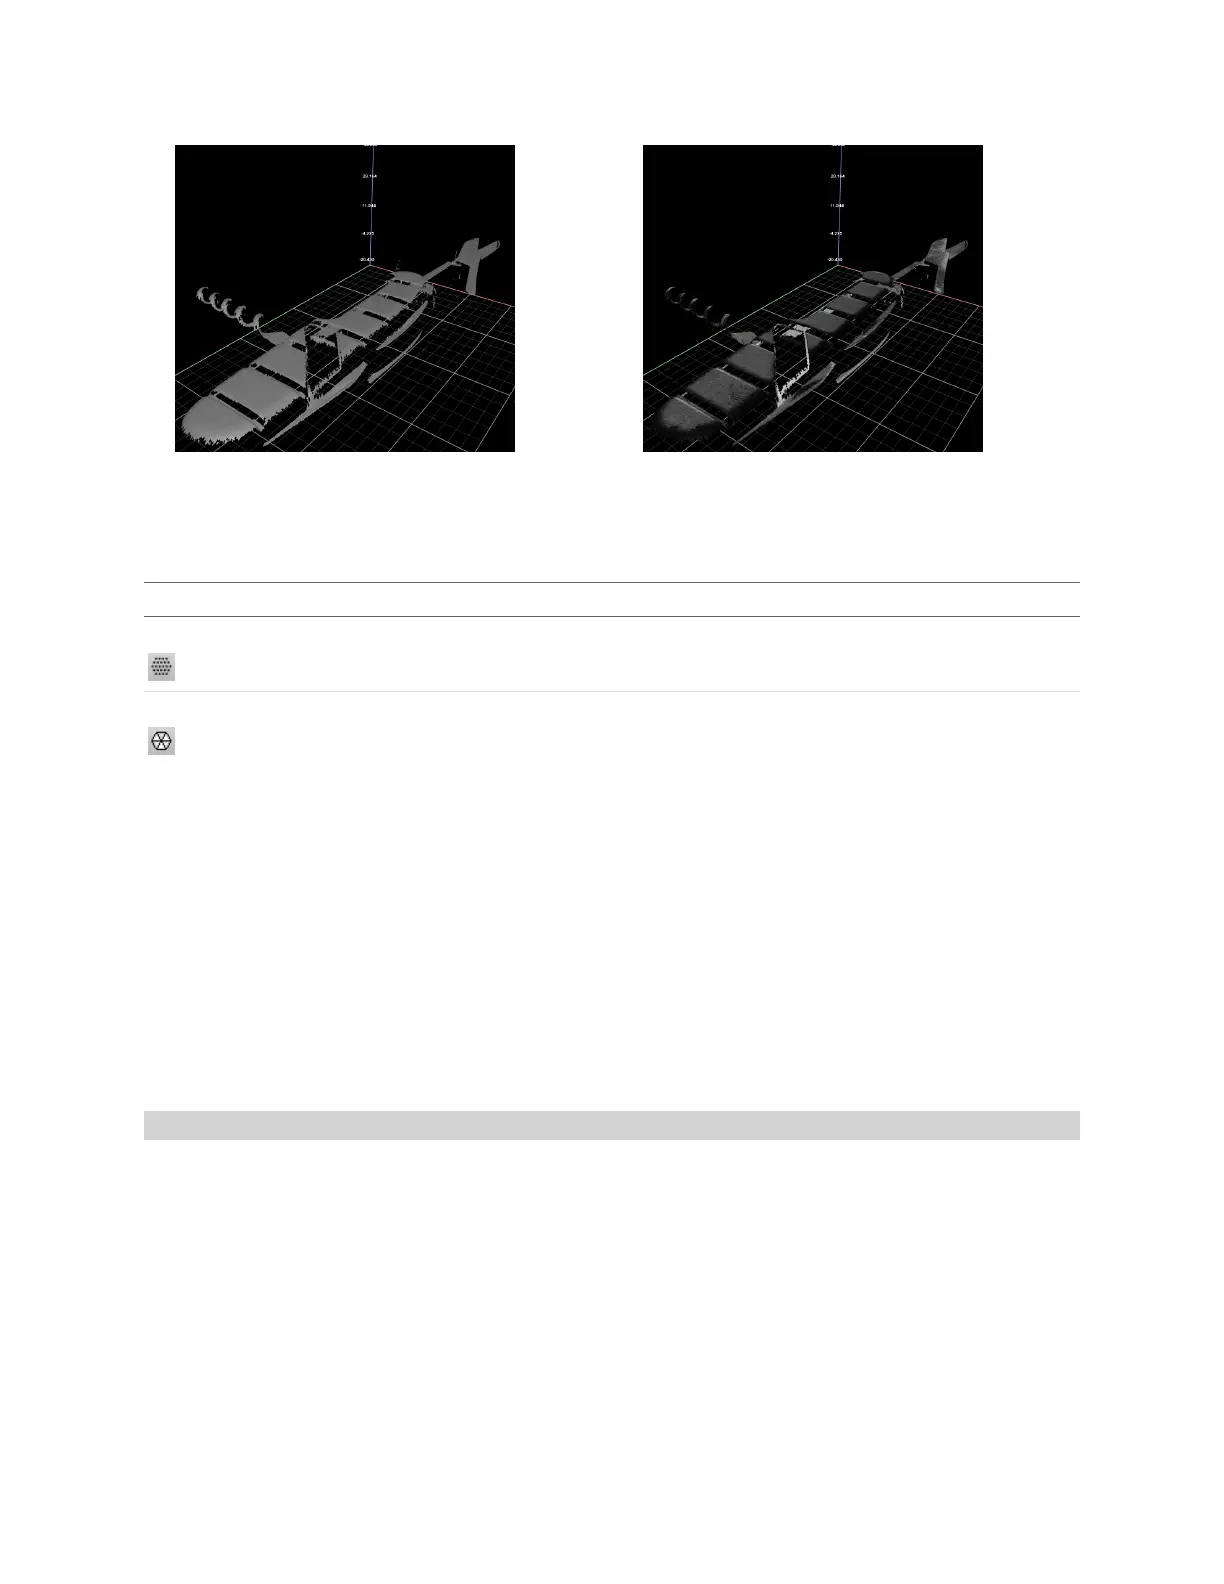
3D viewer with uniform overlay 3D viewer with uniform overlay
In 3D mode, you can choose how the data viewer renders the model:
Rendering Mode Description
Point Cloud (default) Renders 3Dmodels using point clouds. Useful in scan data that contains noise around edges,
and shows hidden structure.
Mesh Renders 3Dmodels using "meshing,"connecting 3Dpoint clouds with polygons.
In a multi--sensor system, data from individual sensors or from a combined view can be selected. While
in the Scan page, selecting a panel (e.g., Sensor or Part Detection panel) will automatically set the
display to the most appropriate display type and display view.
To manually select the display type and the display view in the Scan page:
1. Go to the Scan page.
2. Select the View options in the data viewer.
Profile, Heightmap, Grayscale, Uniform, or Intensity can be selected from the left drop-down list.
The view from an individual sensor or the combined view of two sensors can be selected from the right
drop-down list.
Height Map Color Scale
Height maps are displayed in pseudo-color. The height axis (Z) is color-coded. The scaling of the height
map can be adjusted.
 Loading...