Gocator Line Profile Sensors: User Manual
Gocator Web Interface • 197
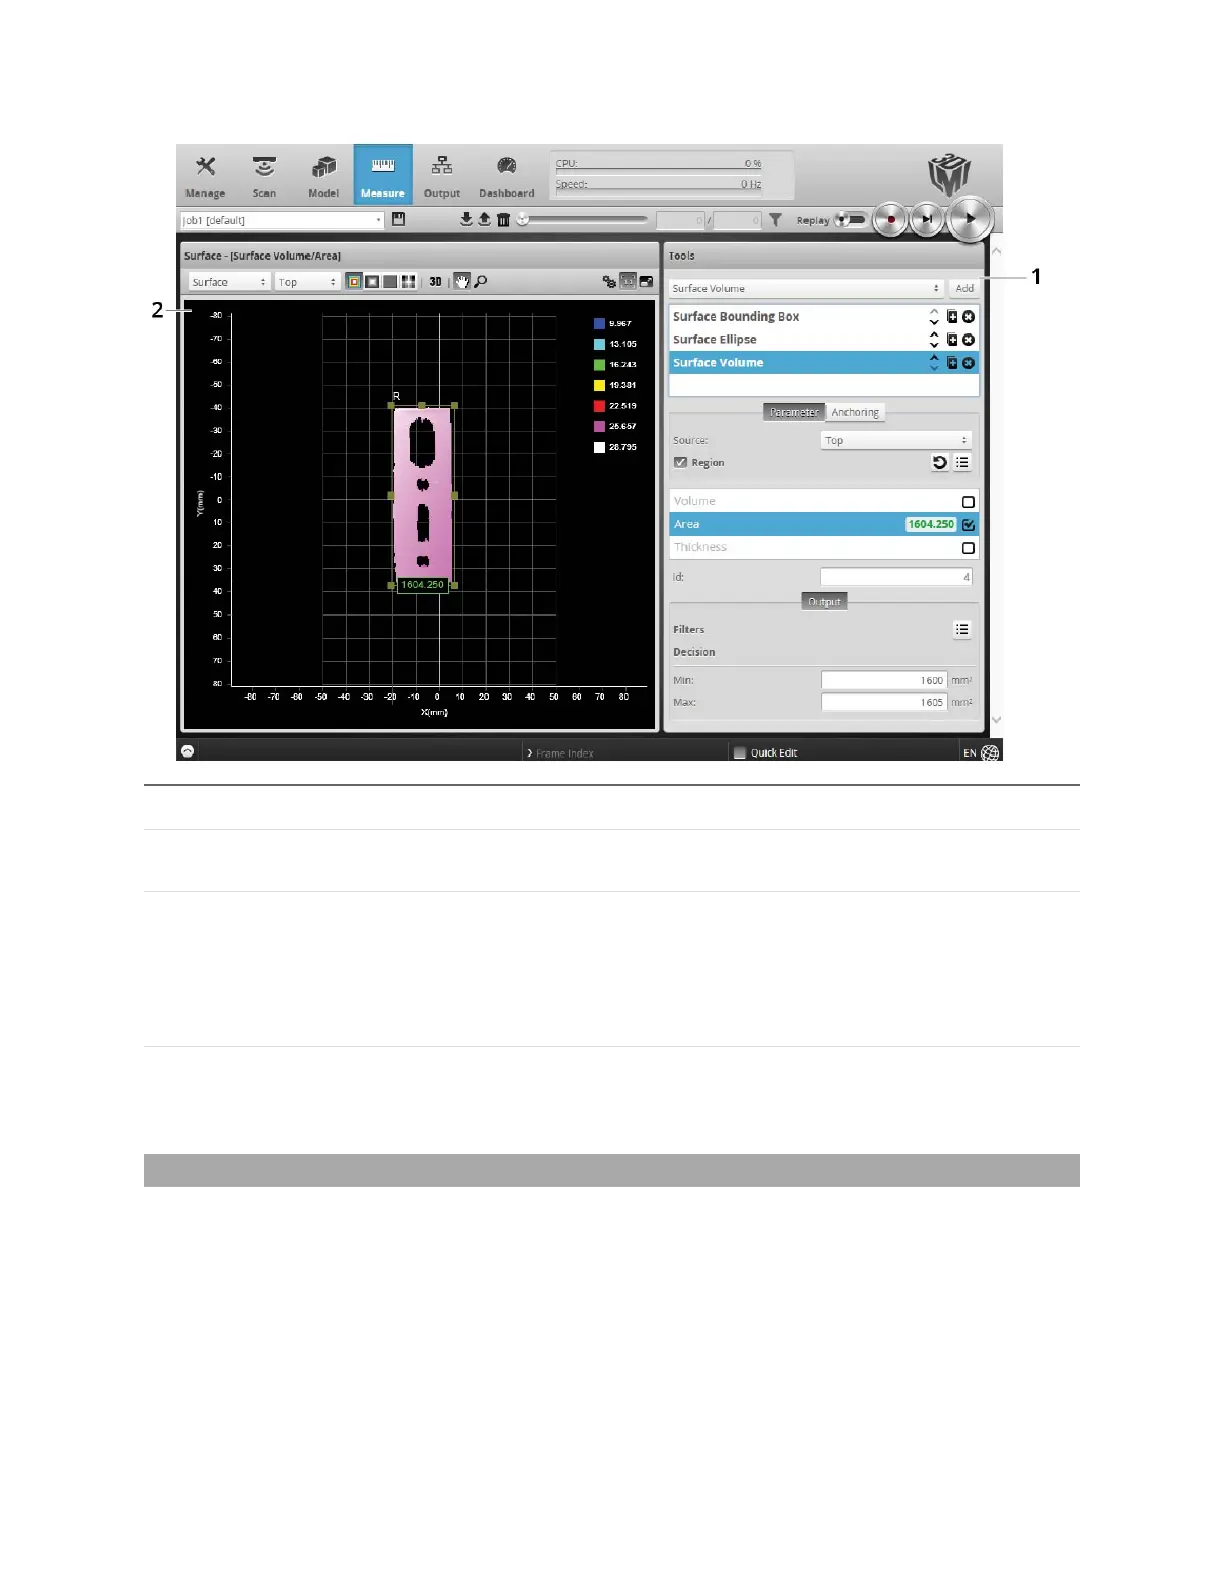
Element Description
1
Tools panel Used to add, manage, and configure tools and measurements (see Tools Panel on the
next page) and to choose anchors (Measurement Anchoring on page 211).
2
Data Viewer Displays video and scan data, sets up tools, and displays result calipers related to the
selected measurement.
Parts are displayed using a height map, which is a top-down view of the XY plane,
where color represents height.
See Data Viewer below.
3 Feature Area
Configurable region of interest from which feature points are detected. These feature
points are used to calculate the measurements. The number of feature areas
displayed depends on which measurement tool is currently selected.
Data Viewer
When the Measure page is active, the data viewer can be used to graphically configure measurement
regions. Measurement regions can also be configured manually in measurements by entering values into
the provided fields (see Regions on page 201).
For information on controls in the data viewer, see Data Viewer Controls on page 160.
For instructions on how to set up measurement regions graphically, see Region Definition on page 173.
 Loading...