Gocator Line Profile Sensors: User Manual
Gocator Web Interface • 301
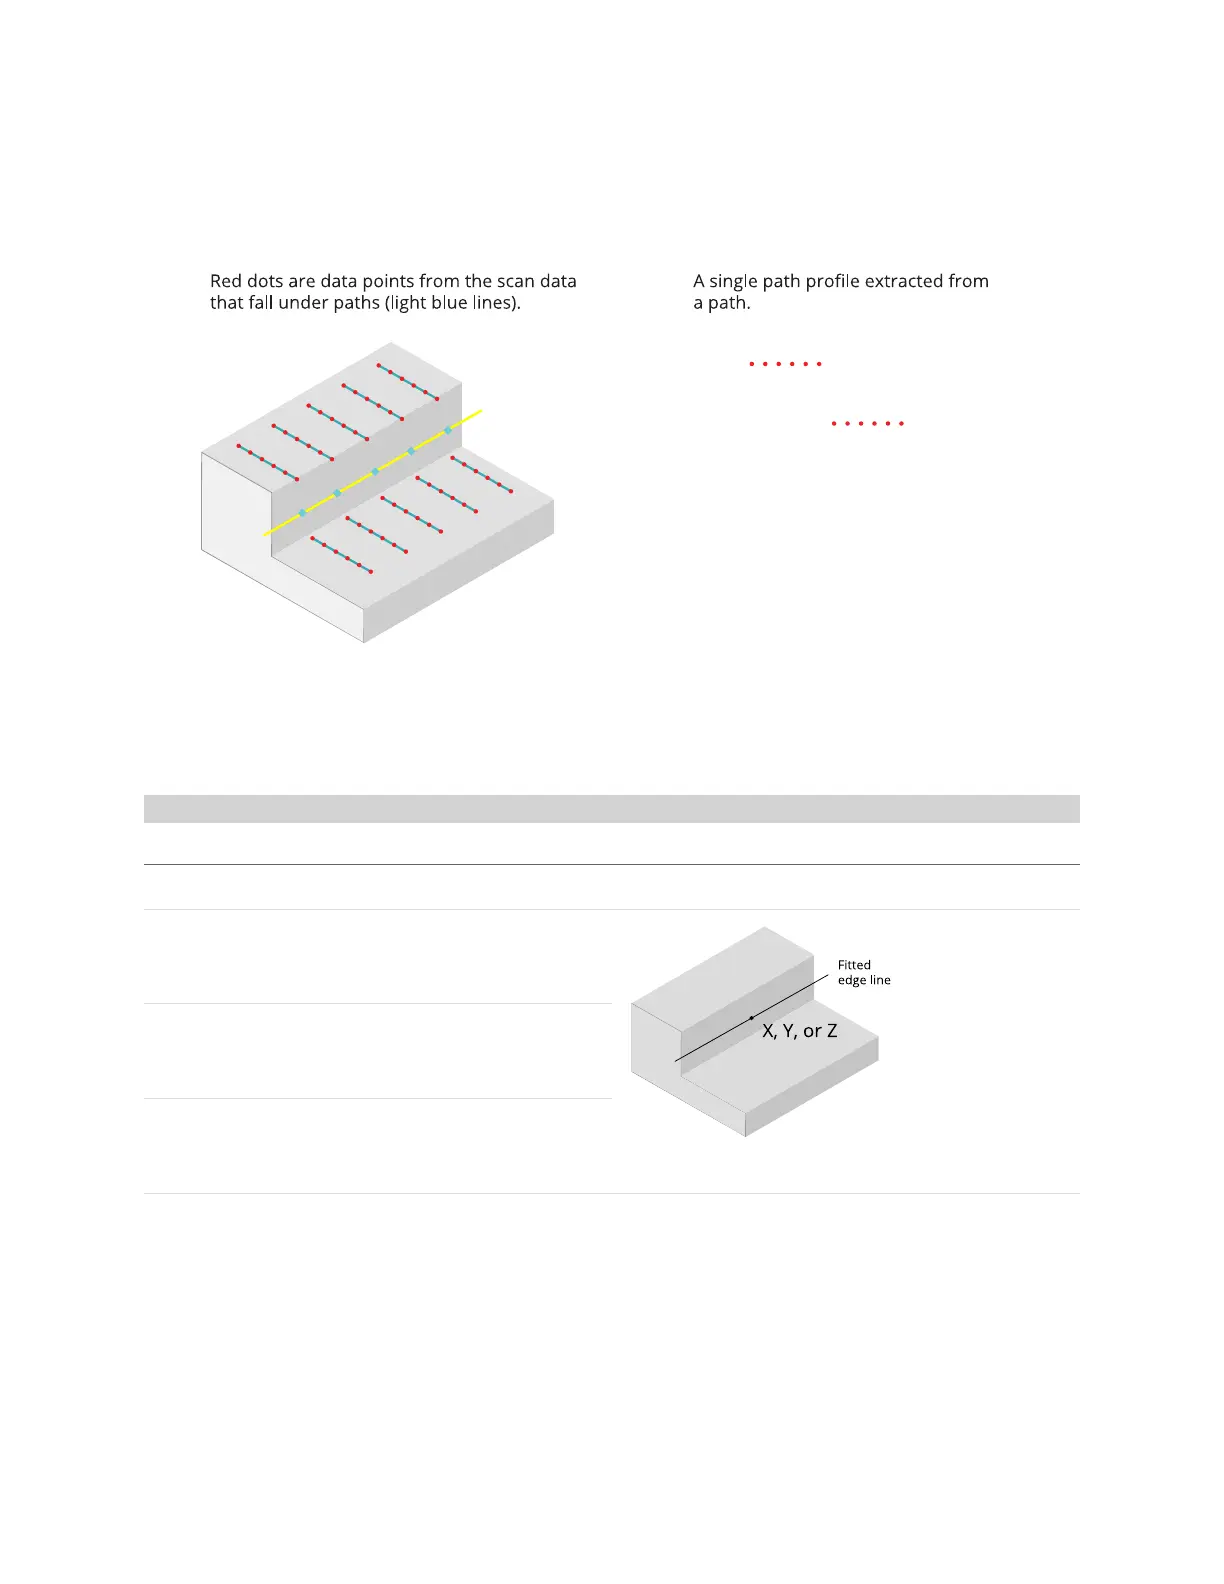
For each path, a profile is generated internally from the height map’s data points that fall under or,
optionally, near the path. The tool then examines each path profile for steps (changes in height) that
meet the criteria set by the tool’s settings, such as minimum height, direction (whether it is rising or
falling), and so on.
For the step on each path profile that matches the settings, the tool places an edge point between the
upper and lower area (light blue diamonds in the interface). The tool then fits a line to those edge points
(yellow line in the interface). You can choose the orientation of the paths around the Zaxis to
accommodate different edge orientations.
Measurements, Features, and Settings
Measurement Illustration
X
Returns the X position of the center point of the fitted edge
line.
Y
Returns the Y position of the center point of the fitted edge
line.
Z
Returns the Z position of the center point of the fitted edge
line.
Measurements
 Loading...