Software Version C
- 92 -
optek-converter C4101 Version 07.2009_1.2US, 23.07.2009
www.optek.com
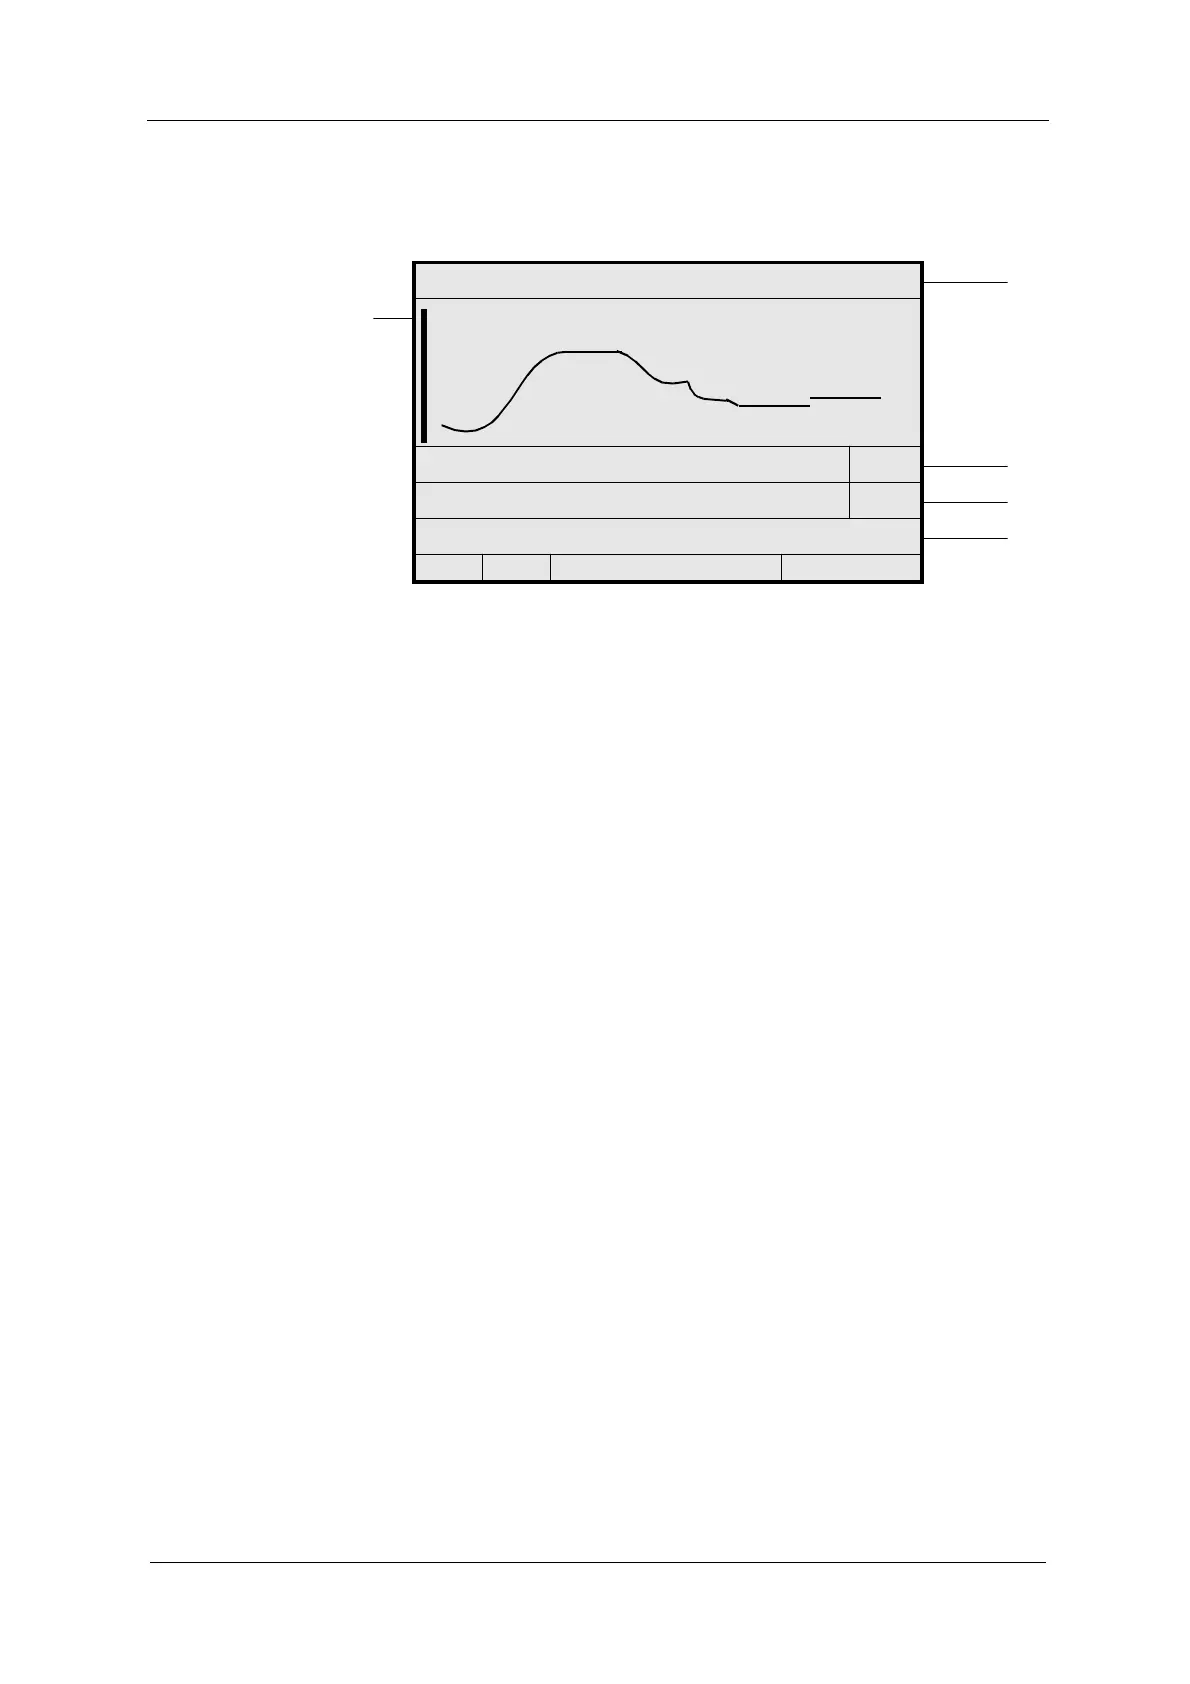
3. The DATA LOGGER display appears.
Fig. 89 Data logger display
The status bar with the product as well as the measuring result name of the
currently shown measuring result is located in the header (24 in fig. 89).
The vertical bar (28) indicates the start of measurement or product change.
Start and end of storage, the storage interval (25) for the currently displayed
measuring results (30 seconds in fig. 89) and the resolution (26) of the display
(7200 X in fig. 89) are displayed below the graph.
The measuring range (27) indicates the measuring range beginning and end as
well as the unit (0.00 - 5.00 CU in fig. 89).
When selecting the DATA LOGGER DISPLAY, the measuring result trend of
7,200 time intervals is shown. Here, the current measuring result is virtually
located on the right-hand side. If there are less than 7,200 measuring points
since the beginning of the storage sector, the trend display starts on the left-
hand side. Shortly after the (re-) start of the data logger, results can be located
on the right-hand side of the visible sector.
Borders between storage sectors are static. One measuring result is shown in
one sector. If a measuring result or a product has been in measuring mode only
shortly, the display is marked from both sides to visualize the borders of the
sectors. Moving the display is impossible in this case.
Product changes automatically lead to an update of the upper status bar and the
measuring range shown in the lower part.
In this menu, you can move the display and adjust the resolution.
P01 - M01
24
28
START 20.05.2006 09:36:00 30 SEC
25
END 20.05.2006 11:23:20 7200 X
26
MEASURING RANGE: 0.00 - 5.00 CU
27
<<<
<
P01
<
>>>