ECDIS-E User Guide Charts
65934012 4-71
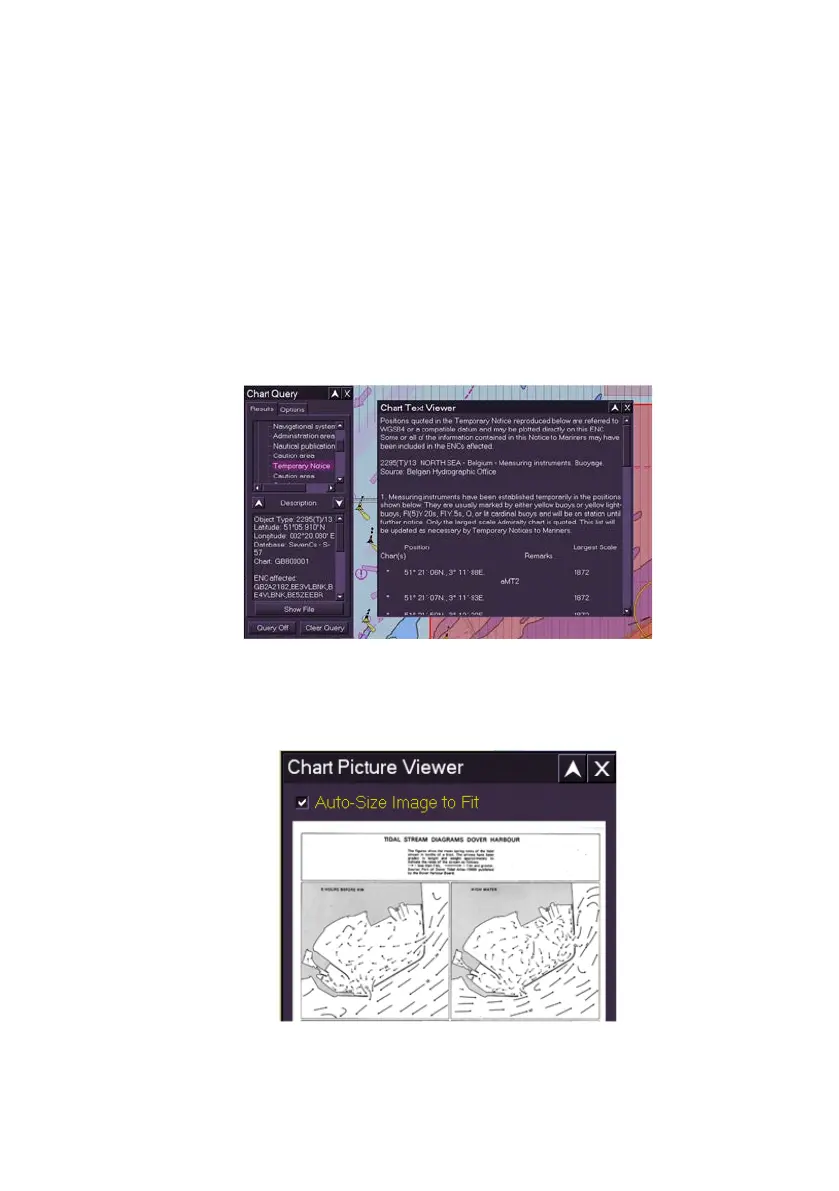
To display AIO data objects do the following:
1. From the Chart Query window select the area on the chart where the
AIO data object resides. Preliminary Notice and Temporary Notice
AIO area objects are rendered with a solid red boundary line and red
dotted pattern fill. No Information AIO area objects are rendered with
a solid grey boundary line and a grey dotted pattern fill.
2. When the AIO object is selected in the Results tab of Chart Query
the Show File button becomes enabled.
3. Click the Show File button. A secondary window opens showing
details of the notice, either as a chart text viewer or where there is
pictorial representation, a chart picture viewer.
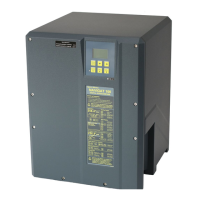
A Chart Picture Viewer displaying a graphic image will include a button to
automatically scale the picture file to fit the viewer window.
4. To scale the picture to fit the chart picture viewer window tick the
Auto-Size Image to Fit check box. The graphic file is re-sized.


 To Next Page